Robbie Thain
Founder, CEO

Large exhibition footprints do not guarantee success; choosing effective booth geometry requires aligning spatial sightlines, traffic flow.
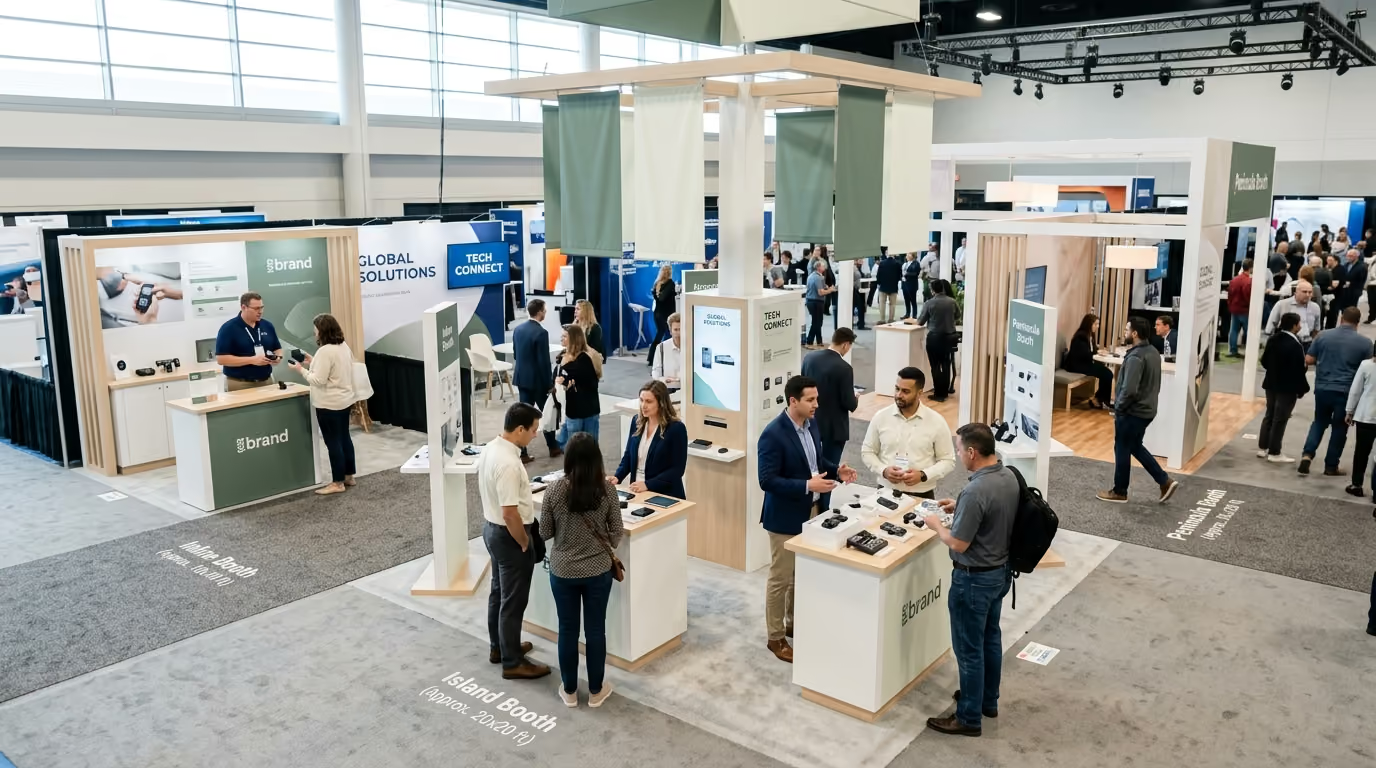
Bigger floor space does not guarantee higher revenue. Many brand leaders believe renting a massive island space automatically solves their pipeline goals. In practice, a bloated footprint without adequate staff or clear product demos creates empty floor space that intimidates passersby. Choosing the correct booth footprint requires matching physical sightlines, attendee traffic patterns, and operational capacity to your specific business goals.
Trade show floors are chaotic environments filled with sensory overload, competing audio tracks, and aggressive brand messaging. Attendees walk miles of carpeted aisles while making split-second decisions about where to pause and where to keep moving. When an exhibitor selects the wrong footprint, visitors get trapped in dead zones or walk past without noticing key products. Operational breakdowns happen when small teams attempt to manage four open perimeters without a clear qualification strategy.
The physical structure of your exhibit dictates how attendees see and access your brand. Industry rules set strict parameters on wall heights, setback requirements, and sightlines to ensure fair visibility across the exhibition hall. Understanding these structural definitions is the first step in selecting a footprint that serves your commercial goals.
An inline or linear booth sits in a straight row with other exhibits, exposing only one side to aisle traffic. According to International Association of Exhibitions and Events (IAEE) display rules, standard linear spaces measure 10 feet by 10 feet, providing 100 net square feet of exhibit area. IAEE guidelines restrict back-wall heights to 8 feet, preventing an exhibitor from blocking the booth directly behind them. Display items in the front half of the space are typically restricted to a 4-foot height limit to preserve side sightlines for neighbors.
This single-aisle geometry concentrates your staff, messaging, and product displays into one forward-facing plane. It works well for focused product shelving, standard lead capture, and controlled one-on-one discussions. Because visitors approach from only one hallway, your visual graphics must communicate your core value proposition within three seconds.
A corner booth occupies the end of an inline row, giving the exhibitor exposure to two intersecting aisles. IAEE rules treat corner spaces under the same structural height restrictions as standard linear exhibits. The critical operational difference is the removal of one side wall, creating a natural open boundary that invites fluid foot traffic.
The second open side allows brands to split visitor traffic into distinct functional streams. You can utilize one perimeter edge for quick product sampling while using the secondary edge for deeper qualification conversations. While empirical studies have not isolated a universal percentage lift for corner spaces over linear units, the dual exposure reduces approach friction for hesitant attendees.
A peninsula footprint is open to aisles on three sides and backs onto either linear exhibits or another peninsula space. IAEE floor plan development guidelines state that peninsula spaces generally measure 20 feet by 20 feet or larger, requiring a minimum of 400 square feet. When backing onto linear booths, back-wall height allowances often reach 16 to 20 feet in the center. The 5 feet on each side of that back wall are restricted to 4 feet in height to respect neighboring linear sightlines.
This layout creates a dominant presence that projects authority across multiple cross-aisles. The three open sides allow large volumes of traffic to circulate around active product demonstrations. It accommodates a distinct physical separation between your public demo areas and semi-private meeting zones.
An island exhibit is exposed to aisles on all four sides, functioning as a standalone destination on the trade show floor. IAEE rules establish that island booths typically measure 20 feet by 20 feet or larger, commonly scaling to 30 feet by 30 feet or 50 feet by 50 feet. Exhibitors can utilize the entire cubic volume up to the venue ceiling height limits, which frequently range from 16 to 20 feet for hanging signs and multi-tier structures.
The four-sided access allows total architectural freedom to build distinct functional areas. You can incorporate custom demo bars, private conference rooms, hospitality lounges, and dedicated storage backrooms. However, four open perimeters require substantial staffing to prevent unassisted visitors from drifting through the space without engaging with your team.
Your event goals must dictate the layout of your space rather than personal preference or prestige. Research from the Center for Exhibition Industry Research (CEIR) tracking 641 exhibitors demonstrated that successful teams match marketing spend and footprint size directly to prioritized outcomes. When planning your presence, evaluate whether your primary mandate is transaction volume, buyer meetings, or brand awareness.
If your goal is gathering qualified contacts or selling product inventory directly, high-density layouts are most effective. A linear or corner footprint forces operational discipline. It keeps staff members stationed at the perimeter edge where they can interact directly with passing traffic.
A compact footprint limits spatial distractions and focuses attendee attention on a clear value proposition. It allows a small sales team to identify buyer intent quickly. Staff can scan badges, answer core questions, and schedule detailed follow-up calls without losing prospects in a cavernous environment.
Brands seeking retail distribution or closing enterprise contracts require structured zones for extended conversations. In an academic study on trade show booth design published in the Journal of Business & Industrial Marketing, researchers observed that visitors often prefer semi-enclosed spaces. These private areas provide spatial comfort, noise reduction, and safety for sensitive commercial discussions.
A peninsula or island footprint supports building closed meeting rooms alongside open display counters. You can review pricing sheets, distributor margins, and supply agreements away from aisle noise. Many brands adopt trade show booth micro zones to separate quick product trial areas from dedicated buyer negotiation suites.
CPG, food, and beverage brands launching new products require physical space to handle simultaneous interactions. When hundreds of attendees gather around a sampling station, narrow aisles become choked with foot traffic. A peninsula or island booth allows visitors to flow around a central prep kitchen or demonstration counter.
Multiple service points eliminate bottlenecking and reduce wait times for eager consumers. This layout gives your team room to execute sensory trials while capturing real-time consumer feedback. Clear walkways around the activation prevent surrounding exhibits from filing spatial complaints with show management.
Understanding how attendees move through an exhibition hall helps you optimize your perimeter layout. A research study on attendee behavior published in the Journal of Convention & Event Tourism identified five distinct attendee segments. These visitor profiles range from focused buyers with pre-planned routes to casual browsers who navigate aisles at random.
Linear exhibits encounter traffic moving along a single lateral path. Attendees glance sideways as they walk, giving your booth less than five seconds to capture their visual attention. If your staff sits behind a central table, they create a physical and psychological barrier that repels visitors.
To maximize single-direction traffic, pull your display elements to the back wall and keep the entrance clear. Position product sampling pedestals directly inside the front perimeter line. This arrangement invites attendees to step off the busy aisle carpet without feeling trapped inside a narrow room.
Corner footprints intercept two separate traffic streams, often capturing attendees as they transition between primary and secondary aisles. This configuration gives your team double the perimeter contact line of an equivalent inline space. You can establish a primary brand hero display on the main aisle while running live demos on the cross-aisle.
The corner setup allows staff to approach prospects from multiple angles without blocking visitor movement. Attendees can pause to watch a demonstration without obstructing the flow of other walking visitors. This dynamic makes corner footprints a practical compromise between cost efficiency and visual access.
An island or peninsula booth presents open borders on three or four sides. While this provides complete access, it creates substantial navigation complexity. Without intentional layout barriers, visitors will wander aimlessly across your footprint, bypassing key messaging panels and staff stations.
Organize your floor plan using clear interior pathways. Anchor the center with a visual focal point, such as an elevated product tower or active demonstration stage. Use low counter seating and graphic walls to steer foot traffic along an intentional journey, guiding them from introductory brand awareness into deeper product trial zones.
Renting floor space represents only a fraction of the total capital required to activate an exhibit. In an empirical study published in Marketing Science examining 85 exhibitor firms, researchers demonstrated that booth performance is a three-stage conversion funnel. The stages comprise visual attraction, visitor contact, and final conversion efficiency. Booth space alone did not drive results without adequate numbers of trained booth staff.
A large footprint with insufficient staffing damages your brand reputation. When an attendee enters a 20-by-20-foot island and finds no one available to answer questions, they walk away frustrated. Conversely, crowding six staff members into a 10-by-10-foot inline booth intimidates passing prospects.
Plan your staffing ratios around active operational zones rather than arbitrary square footage. A standard 10-by-10-foot booth operates efficiently with two to three active staff members. A 20-by-20-foot island generally requires six to eight trained specialists to manage greeting perimeters, demo stations, and private meeting suites simultaneously.
CEIR spending studies show that larger booth footprints skew budget allocations heavily toward design, production, shipping, and material handling. Drayage fees, which cover moving your freight from the convention loading dock to your booth space, scale based on total weight and crate dimensions. Island spaces often require overhead truss rigging, dedicated electrical drops, and specialized union labor for multi-day installations.
A smaller footprint keeps operational overhead low, allowing brands to allocate more capital toward high-caliber staff training, premium sampling inventory, and targeted pre-show marketing. Before committing to a larger footprint, model the full logistical profile including shipping, storage, and utility fees. You can review strategies on how to build a trade show booth experience that converts to maximize impact within strict budget boundaries.
Bigger exhibitions do not always produce higher engagement quality. A collaborative study by CEIR and PCMA examining data from 21 exhibition organizers revealed that smaller events often record higher Net Promoter Scores than massive industry expos. Attendees at smaller expos report closer peer networking, while attendees at giant expos report greater satisfaction with broad supplier access.
Select your booth size based on the specific event scale and audience density. At a focused regional conference, a modest corner or tabletop exhibit can capture high-value buyer conversations at minimal cost. At a premier national trade show, investing in a prominent peninsula or island may be required to maintain category leadership among competing enterprise brands.
Traditional convention center floor plans are not the only avenues for live commercial engagement. Brands increasingly leverage tabletop displays, mobile trailers, and specialized experiential builds to engage audiences across diverse event environments. While standard industry benchmarks do not isolate tabletop and mobile performance as distinct statistical categories, their real-world utility depends on execution agility and total program economics.
Tabletop setups typically feature a 6-foot or 8-foot skirted table placed in a hotel ballroom, sponsor corridor, or regional summit hall. This format offers minimal setup friction, low travel costs, and rapid installation. It eliminates drayage and rigging expenses entirely.
The strategic trade-off is limited physical presence and zero architectural isolation. Because you cannot construct tall graphic walls or private meeting enclosures, your staff must drive all engagement through proactive verbal outreach. Tabletop configurations excel at early-stage market validation, association meetings, and high-volume consumer sampling where complex booth builds are unnecessary.
Mobile marketing units, including custom trailers, converted camper vans, and modular pop-up containers, bypass traditional convention center footprints. These assets travel directly to consumer festivals, retail parking lots, sporting venues, and multi-city B2B tour stops. They offer brand consistency and rapid deployment across multiple markets without recurring show labor charges.
A mobile asset must be evaluated based on total program lifecycle costs rather than single-event expenses. While the initial capital expenditure to fabricate a custom trailer is substantial, the asset amortizes across dozens of activations. Brands frequently find success bridging trade shows with high-conversion roadshows to extend their reach beyond annual convention dates.
Experiential builds are defined by their interactive mechanics rather than a fixed spatial footprint. An experiential build can occupy a 10-by-10-foot inline space with an interactive sensory testing station. It can also fill a 40-by-40-foot footprint featuring live cooking stages, gamified digital challenges, and social content studios.
When designing experiential activations, calculate your space requirements around human workflow. Account for participant queueing, dwell times, staff prep areas, and safety clearance zones. Many teams adopt demo-centric experiences and revenue-focused lead capture to ensure interactive theater drives measurable commercial results.
Converting a physical floor space into measurable pipeline requires disciplined field execution. Use this operational playbook to align your team, manage spatial logistics, and capture qualified demand during live event hours.
Calculating real Return on Investment (ROI) from trade show footprints requires monitoring both real-time operational efficiency and long-term commercial pipeline. Evaluate your footprint selection using structured lead and lag indicators.
Field execution requires adapting booth layouts to the fast-moving realities of physical event venues. In our experience, high-growth food and beverage brands often struggle to balance high-volume sampling with serious retail buyer meetings within a single footprint.
We have executed over 1000 campaigns across all 50 states, bringing brands to life in every major U.S. market. From retail demos in Seattle to roadshows in Miami and events in Honolulu, our teams activate brands wherever our clients' audiences are located.
A functional beverage client needed to drive trial for three new functional soda flavors while pitching regional grocery buyers at a major food expo. The initial instinct was to rent an open 30-by-30-foot island and place sampling tables on all four perimeters. Our team recognized that an open four-sided perimeter would create operational chaos. Passing crowds grabbing quick drinks would overwhelm the sales staff, preventing them from identifying commercial retail buyers.
Our team reconfigured the space into an intentional 20-by-20-foot peninsula build with two distinct functional micro-zones:
This structured footprint separation yielded strong results. Over three show days, the team executed 4,200 consumer taste tests and conducted 48 structured buyer meetings. The activation generated 28 new regional retail authorizations across 450 grocery locations. By separating high-volume public trial from quiet business negotiation, the brand maximized both consumer buzz and wholesale revenue. You can learn more about this approach by reading about designing trade show booths for product trials and buyer meetings.
Selecting and activating an exhibition footprint involves complex physical, financial, and logistical trade-offs. Avoid these common operational mistakes when planning your next trade show campaign.
Securing a 30-by-30-foot island when your company can only send three team members produces empty dead space. Passing attendees perceive the booth as abandoned and avoid entering. Match your footprint directly to your active staffing capacity, ensuring every open perimeter has dedicated coverage.
Setting up 6-foot banquet tables directly along the aisle creates a defensive wall that discourages visitors from stepping inside. Pull display counters inside the booth perimeter to create welcoming entry paths. Position staff members in front of displays with open body language rather than sitting behind desks checking laptops.
Attempting to review pricing models, contract terms, or retail margins on a loud, crowded aisle undermines buyer focus. If your primary objective involves closing enterprise deals, ensure your layout includes acoustic separation. Utilize solid partition walls, directional lighting, and carpet padding to establish a quiet professional environment.
Booking an island booth without checking ceiling drop points, hanging sign fees, and floor port locations leads to expensive on-site surcharges. Review venue utility maps before submitting your floor plan to show decorators. Plan electrical drops and cable routing during initial design phases to prevent unsightly tripping hazards across your booth floor.
Selecting the right trade show booth footprint is an operational decision that defines how attendees encounter, experience, and buy from your brand.

30 Years Experiential & Retail Activation Partner for CPG & Beverage Brands | Multi-Market Demos, Roadshows & Costco/Club Programs That Actually Sell