Robbie Thain
Founder, CEO

Trade show booth ownership seems cheaper over time, but ongoing storage fees and freight costs often make exhibit rentals the smarter financial choice.
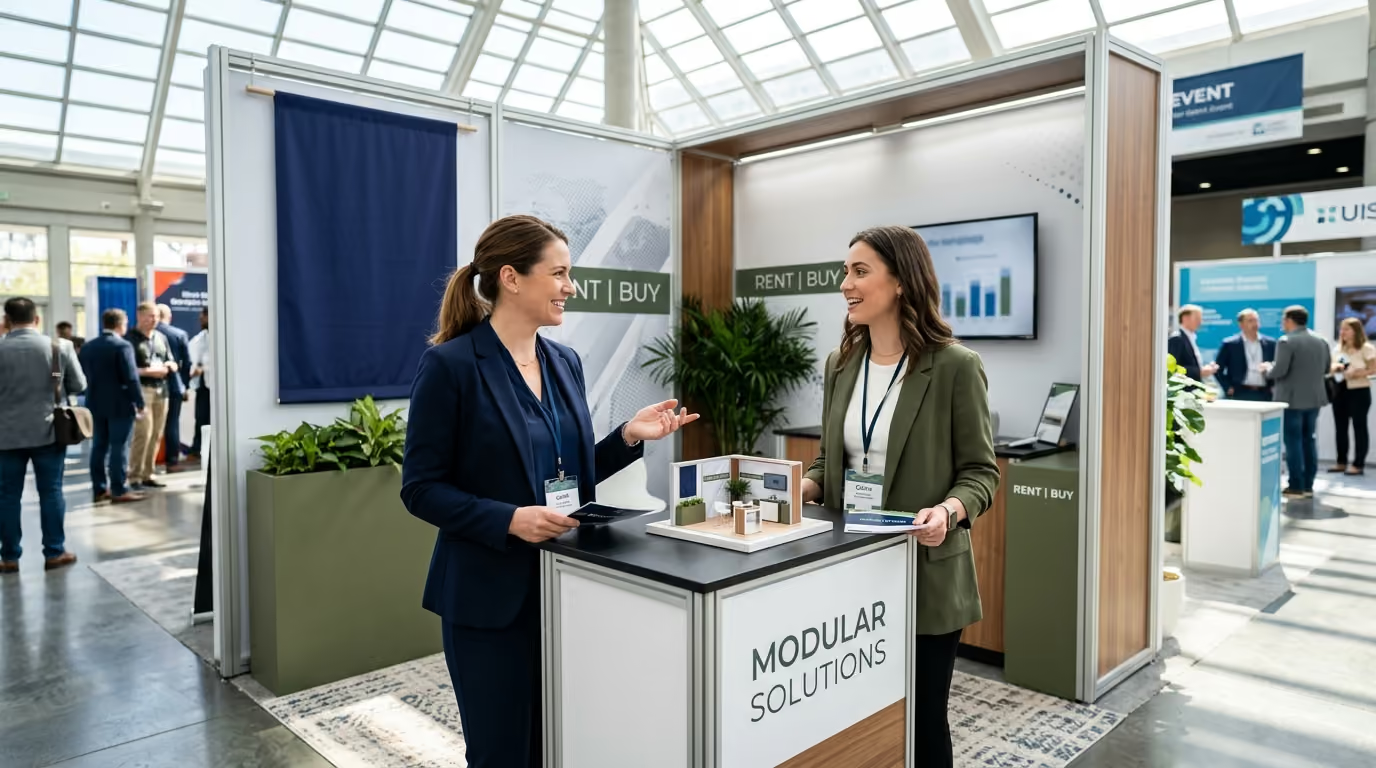
Trade show exhibit selection is a portfolio asset management decision rather than a simple comparison between a rental invoice and a purchase price. Evaluating your multi-year event schedule, logistics capacity, and brand flexibility reveals whether renting, purchasing, or deploying a modular hybrid system delivers the highest Return on Investment (ROI).
The exhibit decision is not a creative debate between a temporary setup and a permanent monument. It is an operating model choice that dictates capital allocation, storage fees, freight schedules, and on-site labor risk for three to five years. Selecting the wrong model ties up working capital in depreciating hardware or drains operating budgets through repetitive short-term fees. This guide breaks down the total cost of ownership, operational logistics, and strategic frameworks required to make an evidence-based decision for your brand.
The trade show floor during move-in is an industrial environment governed by strict deadlines, union labor jurisdictions, and tight physical bottlenecks. Hundreds of crates arrive simultaneously at marshaling yards while semitrucks wait hours for an open loading dock. Inside the hall, forklifts maneuver through narrow aisles crowded with wooden crates, electrical cabling, and discarded wrapping materials. If your shipping crates arrive thirty minutes past your targeted check-in window, your freight gets pushed to the back of the queue. That delay triggers costly overtime labor rates for your installation crew and risks booth completion before the opening bell.
In this environment, theoretical plans collide with operational friction. Crates arrive with missing hardware, structural extrusions suffer bent corners during transit, and local union crews work under strict jurisdictional rules. A team that owns a custom exhibit often discovers that minor structural damage requires specialized on-site fabrication to correct. Meanwhile, unexpected drayage charges mount as the official show contractor moves materials from the marshaling yard to the booth footprint. Every extra pound of custom wood and steel increases handling costs before your team engages a single attendee.
When marketing directors manage physical assets without dedicated logistics support, the booth becomes a financial drain. Brand leaders often spend move-in day tracking missing freight pallets instead of briefing booth staff or prepping retail buyer presentations. The physical structure should support commercial conversations, yet poor operational planning turns it into a source of friction. Understanding the reality of the show floor is the first step toward choosing an exhibit system that protects your budget and your sanity.
Evaluating exhibit options requires precise definitions of the four primary operating models available to modern exhibitors. Each model carries distinct financial liabilities, operational requirements, and structural characteristics.
An exhibit rental is a temporary structural system supplied, configured, installed, and removed for a specific event or series of events. Rental agreements typically bundle structural hardware, standard lighting, foundational furniture, and core fabrication into an event-based operating expense. The exhibitor purchases custom graphic panels while the provider retains ownership of the underlying frames, trusses, and structural extrusions.
Renting transfers long-term storage, structural repairs, and asset depreciation to the exhibit house. It allows brands to change their visual footprint, layout, and architecture between shows without writing off capital assets. However, rental costs accumulate quickly if you run a high-frequency event calendar with static booth requirements.
Exhibit purchase involves buying the physical hardware, structural frameworks, graphics, lighting, meeting rooms, crates, and specialized display elements. The buyer capitalizes the asset on the balance sheet and amortizes the cost over a multi-year useful life. Ownership grants total control over architectural design, proprietary product fixtures, and structural customization.
Ownership requires an ongoing operational infrastructure. The buyer assumes direct responsibility for monthly warehouse storage, preventative maintenance, graphic replacement, insurance, and regular component refurbishment. Ownership does not eliminate event-by-event expenses, because crating, freight, drayage, and installation labor apply to every deployment.
A modular exhibit uses standardized, reconfigurable components such as aluminum frames, silicone-edge fabric graphics, interchangeable counters, and integrated display shelving. The strategic advantage of modularity is structural adaptability across different footprint sizes. A well-engineered modular inventory can form a 10-by-10 inline booth at a regional conference, expand to a 10-by-20 configuration, or assemble into a 20-by-20 island display.
Modular ownership offers a middle path between custom fabrication and temporary rentals. It provides consistent brand presentation across multiple venues while keeping component weights low. Lighter aluminum frames reduce shipping costs and lower material handling fees across an annual tour.
The hybrid model combines owned core assets with rented structural components. An exhibitor owns branded reception counters, product display fixtures, digital interactive kiosks, and modular fabric backwalls. When attending a premier industry expo requiring a large presence, the company rents structural towers, double-deck lounges, or overhead hanging signs.
This approach balances long-term brand consistency with geographic and architectural flexibility. It limits the total volume of owned assets sitting in storage warehouses between events. Brands can scale up their presence for tier-one events and scale down for secondary regional expos without maintaining redundant physical inventory.
Comparing exhibit options requires looking beyond initial purchase invoices and base rental quotes. The true financial impact is governed by the Total Cost of Ownership (TCO) across a three-to-five-year planning horizon. A realistic TCO model incorporates all auxiliary expenses generated throughout the physical asset lifecycle.
Use this baseline formula to calculate ownership costs:
Ownership TCO equals initial acquisition cost plus lifetime storage fees plus lifetime maintenance and refurbishment plus cumulative event logistics plus cumulative installation and dismantle labor plus graphic updates minus residual asset value.
To determine whether purchasing makes financial sense, divide the Ownership TCO by the total number of planned events. Compare that per-event figure against a fully burdened rental quote for an identical booth configuration.
Evaluating ownership requires modeling several distinct cost centers:
Industry supplier data from Xibit Solutions indicates that custom booth fabrication ranges from $100 to $400 per square foot. A 10-by-10 display generally costs between $10,000 and $40,000 to purchase outright. A 20-by-20 island structure frequently requires an upfront capital investment between $40,000 and $160,000.
Monthly storage costs add $300 to $1,000 per month depending on crate volume and warehouse location. Annual maintenance typically demands 3% to 5% of the exhibit value per show to repair normal wear and tear. When budgeting an event program, consult a structured trade show activation budgeting framework to avoid missing secondary operational line items.
Booth structure costs operate inside a larger total event expenditure envelope. Research from ShowHero indicates that median exhibitor all-in spending reached $32,400 per show in 2025, representing a 14% increase over 2022 levels. The physical structure represents roughly 20% to 30% of total show costs. Floor space rental, travel, entertainment, staff lodging, and on-site utility services make up the remainder.
Data published by Pure Exhibits models a three-year ownership program for a 20-by-20 island exhibit used at three shows annually. The total ownership cost ranged between $140,000 and $220,000 across nine total shows. A comparable turnkey rental program across those same nine events ranged from $85,000 to $126,000.
Supplier guidelines often state that purchasing breaks even around three to five shows per year. That rule of thumb fails when companies switch booth sizes, change brand messaging, or face high drayage penalties. An owned display that remains in storage because of a sudden market pivot delivers zero return while generating ongoing warehouse bills.
Your annual event calendar should dictate your exhibit operating model. Analyzing event frequency, footprint uniformity, and audience segmentation reveals whether an asset purchase or a rental structure fits your operating goals.
Brands attending one or two events per year face high asset depreciation and disproportionate storage costs if they purchase an exhibit. In this scenario, structural assets spend ten to eleven months per year sitting in a warehouse. Storage fees, insurance, and inspection retainers continue accruing while the asset produces no commercial pipeline.
Renting provides the cleanest financial execution for low-frequency exhibitors. It converts fixed balance sheet liabilities into variable operating expenses tied directly to specific sales initiatives. If market conditions change or an event is canceled, the company avoids carrying unamortized capital assets.
Companies exhibiting at six or more regional or national events with identical footprint dimensions gain significant financial advantages through modular ownership. When a brand deploys a standardized 10-by-20 or 20-by-20 layout repeatedly, the per-event hardware cost drops below equivalent rental rates by the second operating year.
Owning a modular aluminum system gives the marketing team complete control over scheduling and hardware availability. The team avoids rental inventory shortages during peak spring and autumn convention seasons. Standardized hardware also streamlines installation and dismantle labor, because crews follow identical assembly plans at every venue.
Many growth-stage enterprises maintain a tiered event calendar. They might anchor their year with a major 20-by-30 island presence at an annual industry expo, supported by four 10-by-10 inline spaces at regional trade conferences. Purchasing separate custom exhibits for every footprint variation is capital inefficient.
A hybrid framework resolves this operational challenge. The organization purchases modular aluminum frames, branded display counters, and digital media kiosks that deploy across all regional 10-by-10 footprints. When preparing for the large annual expo, the team integrates rented architectural elements, hanging structures, and private conference rooms around the owned core components. This approach supports a high performance trade show activation plan without overextending capital reserves.
Logistical execution represents the most common source of budget overruns in experiential marketing. Misunderstanding the division between transportation freight and venue material handling leads to severe cost variance.
Freight refers to the long-haul over-the-road transportation of exhibit materials between your warehouse and the event destination city. Exhibitors select their preferred freight carriers, negotiate shipping rates, and set transit schedules based on standard logistics practices.
Drayage, also designated as material handling, covers the mandatory movement of freight from the venue loading dock to your physical booth space. In the United States, general services contractors such as GES or Freeman hold exclusive contracts to manage dock operations. Exhibitors cannot use their own staff or independent freight drivers to unload trucks and deliver crates to the booth.
Material handling is billed using a hundredweight (CWT) pricing model, which charges a fixed dollar rate per one hundred pounds of freight. Published rates routinely span $60 to $160 per hundredweight, with standard minimum shipment thresholds set at 200 to 300 pounds. Heavy materials like solid timber, structural steel, stone countertops, and thick glass displays dramatically inflate drayage invoices.
Drayage pricing is heavily influenced by timing and delivery conditions:
An owned custom booth weighing 8,000 pounds can easily generate over $10,000 in venue drayage fees at a single major convention. A lightweight modular tension-fabric system delivering an equivalent visual footprint might weigh only 2,200 pounds, saving thousands of dollars per show on material handling alone.
Exhibitors can ship freight to an advance contract warehouse up to thirty days prior to the event or ship directly to the convention center during designated move-in windows. Advance warehouse shipping carries a slight handling premium but provides critical operational advantages. Materials are staged early, inspected for transit damage, and placed in your booth space before your labor crew arrives on site.
Direct-to-show shipping eliminates one warehouse handling step but introduces substantial operational risk. If a common carrier encounters highway delays, weather disruptions, or long marshaling yard queues, your installation crew sits idle on the show floor. Idled union labor continues billing hourly rates while waiting for delayed freight to reach the booth dock.
Maintaining owned exhibit inventory requires climate-controlled storage, systematic barcoding, and regular post-show inspections. In our experience across more than 1,000 activations across all 50 states, physical displays suffer cumulative wear during transit and handling. Laminated edges chip, tension fabrics collect grease, and aluminum locking pins strip out over time.
If you own an exhibit, you must budget for post-show asset audits. Technicians must open every transport crate, inspect electrical components, verify graphic cleanliness, and replace lost fasteners before repacking. When you use a full-service rental program, the exhibit supplier absorbs structural maintenance, hardware testing, and storage management as part of their turnkey service fee.
Your exhibit structure must support your commercial strategy on the trade show floor. Choosing between rental and ownership requires balancing architectural uniqueness against operational flexibility.
Certain commercial activations demand custom architectural solutions that stock rental catalogs cannot supply. Brands marketing heavy industrial equipment, complex mechanical hardware, or medical devices require reinforced flooring, custom plumbing lines, and integrated high-voltage power drops. In these cases, custom-fabricated owned fixtures ensure product displays function reliably.
CPG food and beverage brands also face distinct functional requirements on the show floor. Preparing hot food samples, maintaining strict health code sanitation standards, and serving draft beverages requires dedicated kitchen storage, built-in handwashing sinks, and NSF-certified prep surfaces. When designing booths for product trials and retail buyers, owning purpose-built sampling counters and commercial refrigeration cabinets prevents operational failures during critical buyer walkthroughs.
Early-stage companies and established brands launching new product categories often adjust their market positioning between quarters. Committing capital to an owned physical structure locks the marketing team into a rigid architectural footprint. If the brand pivots its packaging, color palette, or target audience six months later, the owned exhibit becomes an obsolete financial liability.
Rental frameworks provide exceptional agility for evolving brands. Marketers can test an open lounge concept at an industry innovation summit, then deploy an enclosed, meeting-room-heavy layout at an executive buyer conference. The brand updates its low-cost fabric graphics while sourcing the underlying architecture from the rental house inventory. This operational flexibility aligns with teams shifting budgets toward higher impact trade show footprints without long-term balance sheet commitments.
Executing an exhibit procurement process requires a methodical, step-by-step workflow to ensure internal alignment and control downstream costs. Follow this practical framework to evaluate your portfolio, select the right operating model, and execute your activations.
Justifying an exhibit operating model requires measuring commercial performance alongside operational cost efficiency. Aligning marketing investments with clear pipeline data ensures your physical presence delivers verifiable business value. Deploying a structured trade show lead capture and qualification strategy connects real-time floor engagement directly into downstream CRM revenue.
Lead metrics track real-time operational efficiency and visitor engagement quality on the convention floor:
Lag metrics measure long-term revenue impact, asset utilization, and financial return:
A rapidly expanding natural snack food brand faced a critical operational bottleneck. After securing national retail distribution across major grocery chains, the marketing director was tasked with executing an ambitious field calendar: forty regional consumer food festivals, eight regional grocery distributor trade shows, and two major tier-one natural product expos.
The brand initially considered purchasing three separate custom wood-and-laminate exhibit structures to cover simultaneous regional dates. The upfront capital requirement totaled $210,000 across the three builds. Furthermore, projected monthly warehousing, freight line-hauls, and union drayage fees across fifty events were estimated at an additional $185,000 annually.
This proposed purchase carried significant risk:
Our team structured an adaptable hybrid exhibit model tailored to their multi-tiered event calendar. Instead of building custom wooden monuments, the brand invested in a lightweight modular aluminum frame inventory with interchangeable tension-fabric graphics for their baseline 10-by-10 and 10-by-20 footprints. They purchased standardized, NSF-certified sampling counters with integrated commercial refrigeration to protect food quality.
For the two tier-one national expos, the brand rented double-deck structures, overhead hanging banners, and enclosed executive conference suites from local rental inventories. The rented components integrated around their owned modular sampling stations.
By avoiding custom balance-sheet asset commitments, the brand achieved measurable financial and operational gains:
Corporate sustainability commitments increasingly govern event procurement. Evaluating exhibit options requires examining material lifecycles, manufacturing methods, transportation efficiency, and end-of-life waste diversion.
The international standard ISO 20121 establishes formal management system requirements for sustainable event operations. It guides organizations in minimizing environmental waste across the entire event supply chain, including stand builders, logistics carriers, and venue contractors. Applying these principles to your exhibit strategy requires looking beyond basic vendor claims.
Research from the Global Association of the Exhibition Industry (UFI) highlights that timber, single-use carpet, graphic substrates, and packaging make up a major portion of exhibition waste streams. Neither renting nor buying is inherently sustainable on its own. The true environmental impact depends on how the physical components are designed, transported, and reused over time.
Rental programs can lower environmental impact when exhibit providers operate shared inventory pools of standardized aluminum frameworks. Reusing core structural extrusions across hundreds of client activations eliminates the raw material extraction and fabrication energy of single-use displays.
However, a rental program fails sustainability standards if the provider fabricates disposable wooden facades, uses non-recyclable PVC vinyl banners, or ships heavy components thousands of miles for single activations. To verify environmental claims, require rental vendors to document their component reuse rates, regional warehouse distributions, and graphic recycling partnerships.
Modular ownership delivers exceptional sustainability when the organization genuinely reuses structural hardware over a multi-year lifecycle. High-grade aluminum frames, silicone-edge fabric graphics printed with water-based dye-sublimation inks, and durable rotomolded shipping cases eliminate single-use trade show waste.
Ownership becomes environmentally damaging when an organization designs a single-use custom exhibit, attends two shows, and discards the structure after a corporate rebrand. Marketers pursuing sustainable event strategies should demand PVC-free substrate certifications, audit carrier fuel efficiency, and ensure all exhibit components can be refurbished or recycled at end of life.
Standard decision models assume predictable show schedules and stable corporate environments. In practice, marketing teams often encounter operational edge cases that demand specialized procurement strategies.
Organizations frequently face overlapping show dates during peak spring and autumn convention cycles. Owning a single custom exhibit prevents a brand from supporting simultaneous events in different regions. In this scenario, building duplicate owned structures creates costly, underutilized inventory during off-peak seasons. The practical solution is owning a core modular system for primary events while using regional turnkey rentals to cover concurrent calendar dates.
Exhibiting in Europe, Asia, or South America introduces complex customs tariffs, international freight delays, localized electrical standards, and strict venue construction regulations. Transporting an owned North American exhibit overseas creates massive shipping expenses and customs risks. Contracting with a reputable regional rental partner within the destination country eliminates cross-border logistics hurdles while ensuring compliance with local venue labor rules.
Enterprises undergoing frequent brand repositioning, packaging updates, or corporate acquisitions face severe asset obsolescence risks if they purchase custom exhibits. An owned display featuring structural cutouts matched to a discontinued product shape quickly becomes an expensive liability. Companies navigating active rebrands should rely exclusively on rental structures with low-cost replacement graphics until brand guidelines stabilize.
Companies demonstrating defense hardware, specialized cybersecurity infrastructure, or regulated healthcare diagnostic systems require dedicated physical security, locked server racks, and shielded briefing suites. Standard rental furniture and open catalog displays often fail to meet mandatory compliance and data privacy standards. In these environments, owning custom, secure architectural enclosures ensures regulatory compliance and protects sensitive commercial property.
While supplier heuristics often cite three to five shows as a general baseline for ownership, show count alone does not dictate the financial outcome. If your booth footprints change between shows, your brand messaging is evolving, or your target cities require long freight hauls, renting can remain more cost-effective even across five or six events. Ownership makes the strongest financial sense when footprints remain uniform, product display requirements are highly customized, and branding is stable.
Drayage is almost never included in standard exhibit rental contracts. The official general services contractor assigned to the event venue assesses material handling fees directly to the exhibitor based on shipment weight and arrival timing. Certain turnkey rental providers offer fully managed on-site packages that coordinate drayage logistics, but the underlying venue handling fees remain a separate pass-through or line-item cost.
A high-quality aluminum modular exhibit system typically delivers a functional lifespan of three to five years, provided it is properly maintained and safely packaged in molded cases. Silicone-edge fabric graphics and brand messaging panels generally require updating every twelve to eighteen months due to market pivots, wear and tear, or new product introductions.
Yes, modern exhibit rental systems are designed specifically to showcase custom branded graphics. The exhibit provider supplies the rental structural framework, while your team purchases custom-printed silicone-edge fabric graphics, direct-print panels, and branded counter wraps. After the show concludes, your team can store the lightweight fabric graphics for future deployments while the provider returns the underlying structural frames to their rental inventory.

30 Years Experiential & Retail Activation Partner for CPG & Beverage Brands | Multi-Market Demos, Roadshows & Costco/Club Programs That Actually Sell