Robbie Thain
Founder, CEO

Forecast and control every cost line in retail product trial: field labor, food safety, cold chain, slotting fees, and verified incremental conversion.
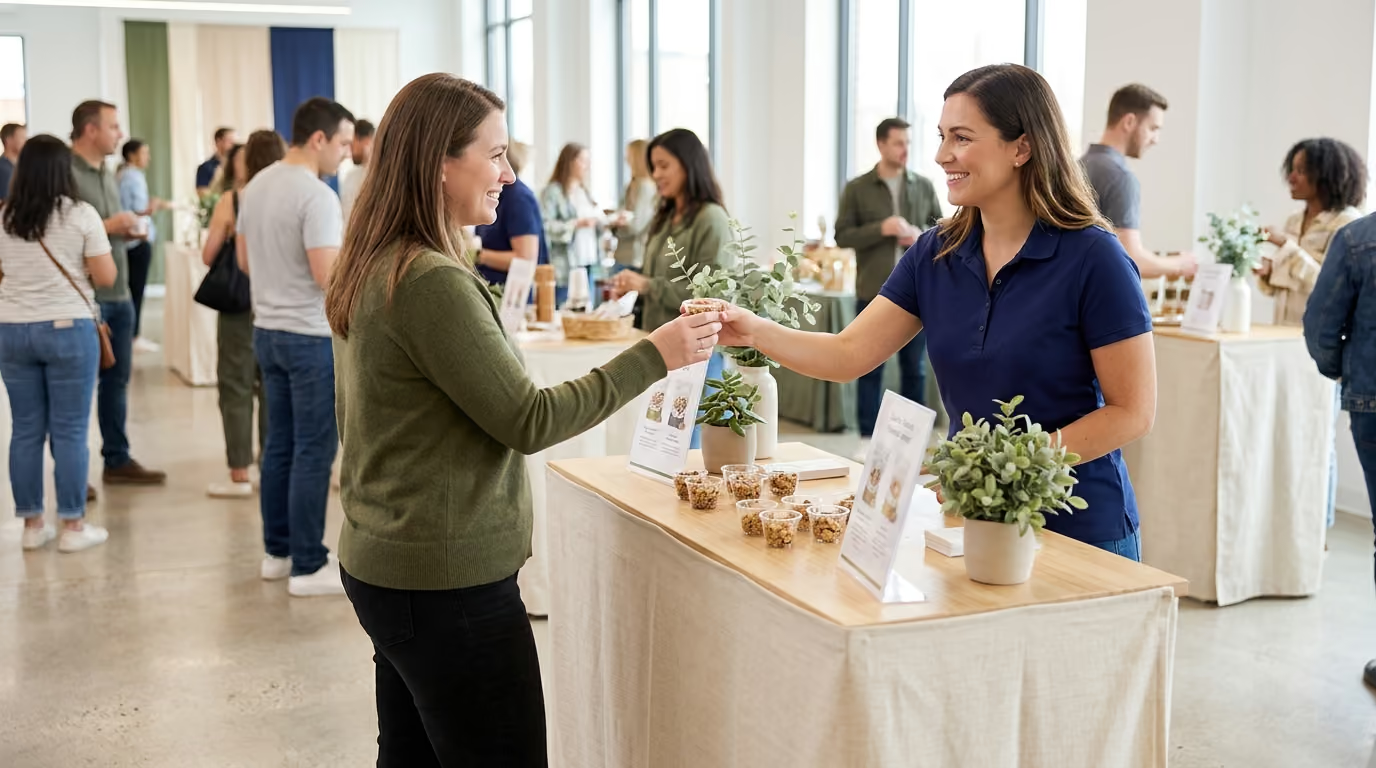
Retail sampling budgeting is not a simple calculation of product volume multiplied by table rental fees. It is a comprehensive financial operating model that accounts for field labor, food safety compliance, cold chain logistics, retail slotting, and verified sales conversion. This guide delivers a complete operational framework to forecast, control, and evaluate every cost component across regional and national retail product trial programs.
Field marketing leaders who master this discipline move beyond vanity metrics and build scalable trial programs that produce a measurable Return on Investment (ROI). By structuring line items around verified incremental conversion rather than gross sample distribution, brands protect their margins while securing crucial retail distribution.
A common scenario unfolds across grocery and club store aisles every weekend. An emerging beverage brand schedules fifty retail demo shifts across three regional supermarket divisions. The initial marketing budget accounted for product stock, branded table runners, and six hours of ambassador labor per location. On Friday morning, reality intervenes across thirty retail locations simultaneously.
Three store managers refuse entry because the field agency submitted general certificates of insurance that lacked specific additional insured endorsements. In four other stores, brand ambassadors discover the scheduled stock never arrived from the regional distribution center, leaving them with empty demo carts. Two team leads in suburban markets encounter health inspectors who demand temporary food establishment permits and active hot-holding temperature logs that were never secured. Meanwhile, six ambassadors discover their designated demo stations have no access to electrical outlets, rendering their commercial blenders completely useless.
By Saturday afternoon, the field marketing director faces thousands of dollars in emergency courier fees, unworked labor invoices, and wasted product inventory. The program distributed less than forty percent of its planned sample volume, yet accrued sixty percent more expense than the approved estimate. Store managers registered formal complaints with category buyers about cluttered aisles and abandoned stations, damaging the brand relationship.
In our experience across national retail activations, these failures rarely stem from poor creative concepts. They happen because brand leaders budget sampling programs as isolated marketing events rather than complex supply chain operations. When you fail to account for site logistics, regulatory mandates, and labor burdens, field execution breaks down rapidly.
To build an accurate budget, you must categorize expenses by their operational behavior rather than broad accounting buckets. Costs behave differently as your retail footprint expands from a single-store pilot to a multi-state rollout. A professional budget segments capital into fixed, variable, and semi-variable tiers to maintain cost control at scale.
Fixed costs remain constant regardless of how many individual samples your team hands out during a shift. You incur these expenses during the development and infrastructure phases of the program.
Variable costs scale directly with the number of stores, event shifts, and individual sample portions distributed. Every added store or increased sample count increases these line items.
Semi-variable costs remain stable across small volume increases but jump significantly once you hit specific operational thresholds. Recognizing these step triggers prevents sudden budget deficits.
To build an accurate projection, connect every single expense to an audited cost driver. Assign each line item to its specific unit metric, such as person-hours, store days, pallet counts, or individual sample units. When reviewing partner proposals, examine every operational assumption through a complete guide to retail product sampling programs to verify that no hidden logistics costs have been excluded.
Labor represents the single largest controllable line item in any retail activation budget. It frequently accounts for fifty to seventy percent of the total event expense. Many brand managers underestimate labor because they calculate staffing budgets solely based on active consumer demo hours.
If an activation runs for six consumer-facing hours, the actual paid labor per specialist typically totals nine to ten hours. The ambassador requires sixty minutes for store check-in, security badging, and fixture assembly. They need forty-five minutes post-event for sanitation, inventory counts, store manager sign-offs, and digital reporting. Mandatory virtual training modules and paid team briefings add another hour of billable time per shift.
Published industry wage data and field marketing benchmarks establish standard commercial ranges for promotional staff. Baseline brand ambassador compensation varies depending on market tier, credential requirements, and event complexity:
The base wage paid to the field worker represents only a fraction of the fully loaded billable rate charged by professional staffing agencies. A compliant staffing rate includes statutory payroll taxes, Federal Unemployment Tax Act (FUTA), State Unemployment Insurance (SUI), and workers' compensation coverage. It also incorporates recruiting costs, background checks, scheduling platform fees, replacement staffing reserves, and agency gross margin.
Attempting to compress labor rates below fair market value creates severe operational hazards. Underpaid ambassadors exhibit higher no-show rates, poor product knowledge, and weak retail engagement. Investing in properly vetted talent directly protects brand equity on the retail floor. You can evaluate competitive staffing options by reviewing field marketing staffing capacity strategies across targeted retail regions.
A common budgeting error is assuming that product cost equals the wholesale value of the distributed samples. Free product provided from marketing stock is never truly free. Every trial portion carries internal production expenses, freight handling fees, warehouse storage costs, and preparation shrinkage.
To calculate true product economics, field operators must establish the precise yield per retail sales unit. A twelve-ounce ready-to-drink beverage bottle does not equal one sample. If your brand serves one-ounce pours in branded cups, that single bottle yields twelve theoretical sample units.
Real-world field conditions always result in product loss that must be modeled into your inventory budget. Commercial sampling campaigns experience shrinkage through multiple standard operating channels:
Research from the Environmental Protection Agency (EPA) highlights the substantial financial impact of discarded food inventory, estimating national consumer food waste costs at hundreds of dollars per person annually. In commercial retail channels, supply chain data published by ReFED estimates an unsold food rate of nearly three percent across retail grocery systems, translating to tens of billions of dollars in lost value. Sampling programs operating in grocery environments must budget a ten to fifteen percent product reserve margin to absorb these standard operational losses without causing mid-shift stockouts.
Before deploying teams, field managers must verify that retail shelves hold sufficient inventory to convert consumer interest into immediate sales. A successful sampling activation that triggers sixty same-day purchase requests will fail financially if the store shelf only holds six units. Brands must coordinate with retail category buyers weeks ahead of time to confirm inventory replenishment, a key lesson explored in our review of how CPG sampling programs drive real sales.
Food and beverage sampling requires navigating a complex regulatory landscape that varies across municipal, county, and state jurisdictions. Failing to budget for compliance documentation and safety hardware can result in immediate shutdown by local health officials and severe retail buyer penalties.
The Food and Drug Administration (FDA) Food Code outlines clear standards for handling unpackaged time and temperature control for safety foods. When food or beverage samples are portioned, cooked, blended, or poured on-site, the demonstration table is legally classified as a temporary food establishment.
Permit acquisition timelines introduce significant administrative labor costs. While standard packaged snack sampling might require only retail store manager approval, heated meat alternatives or dairy beverages require health department filings submitted thirty to sixty days in advance. If your agency manages filings across multiple county jurisdictions simultaneously, administrative management hours must be budgeted accordingly.
Every major retail chain, property owner, and convention venue enforces strict risk transfer mandates. A standard corporate commercial general liability policy rarely satisfies large retail networks on its own.
Retail partner agreements typically require a certificate of insurance providing two million to five million dollars in general aggregate coverage. Retailers routinely demand being named as an Additional Insured on a primary and non-contributory basis, complete with a formal waiver of subrogation. If your activation serves hot food, alcohol, or personal care products, you must verify that product liability and completed operations endorsements are active. Factoring insurance rider fees into your early estimates prevents costly administrative delays before load-in.
Transporting demo assets, branded physical fixtures, and temperature-sensitive inventory across a multi-store network requires specialized logistics planning. Logistics costs involve far more than standard parcel delivery fees.
The American Transportation Research Institute (ATRI) documented an average commercial truck operating cost of $2.336 per mile in their 2025 operational report. This figure highlights the substantial economic pressure on freight and transport operations. When planning mobile tours or multi-market retail store drops, field operators must calculate line-haul freight, local courier rates, and personal vehicle mileage reimbursements.
When outfitting retail sampling teams, marketers must evaluate the financial trade-offs between purchasing custom branded physical fixtures and renting generic event infrastructure.
Custom-fabricated sampling carts provide exceptional visual branding, integrated refrigeration, and clean storage compartments. However, purchasing hardware triggers ongoing warehousing, crate maintenance, asset tracking, and reverse logistics costs.
If your brand plans a brief six-week seasonal retail push, leasing standard commercial fixtures and wrapping them in vinyl graphics is often more economical. For continuous year-round retail demo programs or permanent club store roadshows, investing in custom physical assets significantly reduces long-term event costs.
Reviewing a detailed mobile tour budgeting and cost framework helps teams compare the operational costs of stationary store demos versus mobile multi-store tours.
Executing a high-performing retail sampling campaign requires disciplined operational workflows. Without structured controls, field expenses expand rapidly through unapproved overtime, wasted product, and uncoordinated logistics.
We have executed over 1000 campaigns across all 50 states, bringing brands to life in every major U.S. market. From retail demos in Seattle to roadshows in Miami and events in Honolulu, our teams activate brands wherever our clients' audiences are located. This nationwide footprint has proven that rigorous field standard operating procedures are the only reliable defense against budget variance.
Fourteen days prior to deployment, the field management team must audit each retail location. Confirm that the exact promotional SKUs have been ordered, delivered, and placed in the store stockroom. Verify that store management has scheduled the demo in their internal vendor log and approved the footprint location. Confirm the availability of power outlets, water access, and pallet jack staging areas to eliminate costly day-of-event delays.
Consolidate physical demonstration fixtures, non-perishable consumables, and branded marketing collateral at regional cross-dock facilities. Group all store supplies into standardized, pre-packed transport kits. Distributing consolidated kits to team leads during pre-campaign briefings eliminates expensive last-minute parcel shipping and courier fees.
Enforce automated digital check-in protocols for all field ambassadors using mobile workforce management software. Team members must verify their on-site arrival within an established geographic boundary thirty minutes prior to the activation window. Real-time check-in visibility allows field managers to dispatch backup personnel immediately if an ambassador fails to report, protecting the client's store investment.
Ambassadors must prepare sample units in strict alignment with portion control guidelines. For hot or cold food demonstrations, staff must record initial and hourly temperatures in a digital compliance log. Maintaining strict portioning standards protects product yield forecasts, while active temperature monitoring prevents inventory spoilage and safety violations.
During low-traffic intervals between sample distributions, ambassadors must inspect and restock retail product shelves. Ensure that primary facings are clean, front-facing, fully stocked, and correctly priced. If the primary shelf runs out of stock, staff must pull backup cases from the stockroom immediately to ensure shoppers can purchase the sampled product.
At the conclusion of the activation window, staff must break down fixtures, sanitize all equipment, and return the retail space to pristine condition. Conduct a physical count of remaining product units, used sample portions, distributed coupons, and ending shelf stock. Upload all operational data, store receipts, and timestamped photos directly into the centralized reporting dashboard before departing the venue.
Proving the financial viability of a retail sampling program requires measuring consumer progression through a structured conversion funnel. Evaluating a campaign solely by the volume of distributed samples produces misleading performance figures.
Academic marketing research published in the Journal of Retailing confirms that in-store product demonstrations generate significant immediate sales lift alongside sustained long-term purchasing behavior. Historical scanner data research across retail grocery networks reveals that effective sampling activations can increase day-of-event sales for mature product lines by over one hundred and seventy percent, while new line extensions can achieve sales increases exceeding nine hundred percent. Furthermore, published consumer research indicates that approximately thirty-five percent of sampled shoppers purchase the product on the same day, with over fifty percent expressing intent to repeat purchase.
Evaluating financial return requires distinguishing between total sales volume and verified incremental volume. Incremental sales represent the units sold directly above the store's historical baseline for that specific day of the week.
Relying solely on immediate single-day sales margin can make a highly profitable long-term campaign appear financially negative. True Return on Investment models must capture repeat purchase velocity over the subsequent twelve to twenty weeks. You can explore these measurement frameworks in detail through our guide on 5 key metrics to prove retail sampling ROI.
For brands balancing multiple retail channels, understanding how to allocate capital between grocery demos, club store activations, and mobile tours is crucial. Reviewing a full funnel sampling strategy for retail demos and roadshows helps marketing leaders optimize their promotional spend across different formats.
A fast-growing plant-based packaged snack brand secured new national distribution across two hundred and fifty premium grocery stores. The marketing leadership team needed to accelerate retail velocity to satisfy category buyer performance benchmarks within the first ninety days.
The initial agency proposal quoted a flat fee of $650 per four-hour retail demo shift. However, a detailed cost review revealed critical operational gaps:
The brand restructured the operating budget around an audited cost-per-converted-shopper model. They partnered with an experiential operations team to execute a controlled pilot across twenty-five locations before authorizing the full rollout.
The optimized pilot yielded exceptional operational and financial results:
By engineering the budget around verified supply chain costs and retail stock readiness, the brand proved positive campaign Return on Investment. They expanded the program across all two hundred and fifty locations, securing permanent shelf placement and expanded secondary distribution. For broader field activation strategies, brands can review our guide on planning high performance trade show activations to align their retail and industry event investments.
Alcohol sampling involves complex legal restrictions that significantly increase operational expenses compared to standard CPG activations. Budgets must include specialized pouring permits, certified alcohol server personnel (such as TIPS or LEAD certification), and dedicated liquor liability insurance policies. Furthermore, many state jurisdictions require licensed third-party promotional agencies to purchase the sampling inventory directly from licensed retailers at full consumer price on the day of the event.
When field ambassadors arrive at a store and discover that promotional stock is missing from the shelves, they must follow an established contingency protocol. The team lead must immediately contact store inventory receivers to search backroom pallets for unopened master cartons. If the product cannot be located, the team should execute an emergency transfer from an adjacent retail store or transition the shift to a secondary brand SKU. Budgeting an emergency logistics and supervisor communication reserve ensures that field labor hours are not wasted.
Certain grocery chains, urban convention centers, and major municipal shopping centers operate under strict collective bargaining agreements. In unionized environments, third-party brand ambassadors are legally prohibited from uncrating freight, assembling display fixtures, plugging in electrical cables, or moving inventory pallets from stockrooms. Brands must hire designated union venue staff to complete physical setup tasks, which can add substantial hourly labor expenses.
Demonstrating products that combine frozen, refrigerated, and ambient components requires specialized physical infrastructure. Budgets must incorporate certified commercial transport coolers, digital temperature monitoring equipment, dedicated ice reserves, and backup thermal carriers. If your activation relies on blending or heating, budget for dedicated 20-amp electrical circuits or self-contained commercial battery generators to avoid tripping store circuit breakers during high-traffic demo windows.

30 Years Experiential & Retail Activation Partner for CPG & Beverage Brands | Multi-Market Demos, Roadshows & Costco/Club Programs That Actually Sell