Robbie Thain
Founder, CEO

Ten cost categories decide whether a tour makes money: vehicles, field labour, cold chain, permits and the return formulas that judge them.

A mobile sampling tour is not a product giveaway. It is a temporary, geographically distributed business operation that requires capital allocation across logistics, fabrication, municipal compliance, field labor, inventory management, and performance analytics. This comprehensive resource delivers an operator-grade financial framework to model the true operational expenditure of multi-city campaigns, calculate unit economics, and measure Return on Investment with mathematical precision.
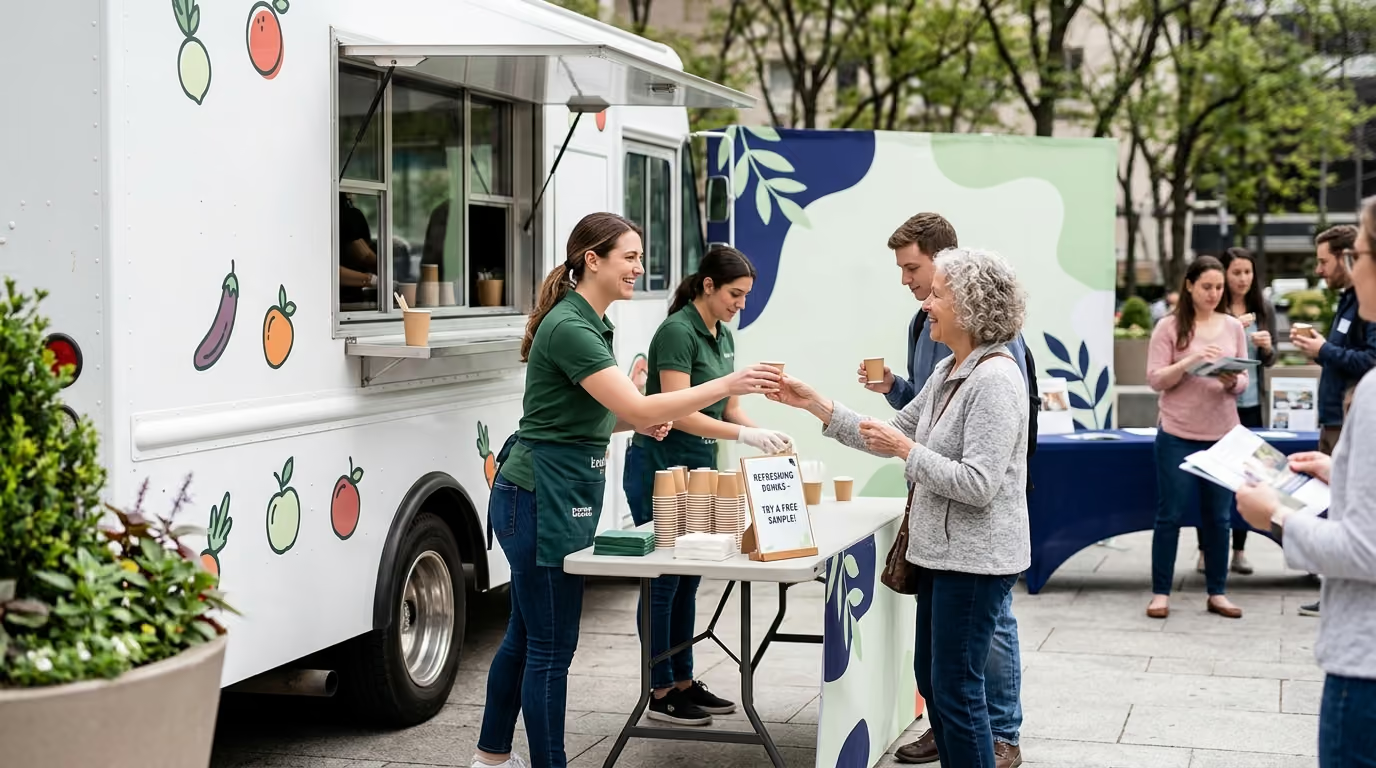
Every experiential marketer recognizes the specific friction of an underbudgeted mobile activation. A branded custom Sprinter van sits on an active municipal plaza while the local health inspector threatens a shutdown over missing greywater containment logs. Three brand ambassadors stand idle because the generator failed, the backup shore-power cable is missing, and the product refrigerated in transit has exceeded safety thresholds. Foot traffic streams past, but there is no verified mechanism to capture consumer data, track retail conversion, or attribute sales back to the initial interaction.
These breakdowns rarely stem from bad intentions. They happen because brand teams frequently budget for the visible brand vehicle while ignoring the operational machinery beneath it. A spreadsheet that only accounts for truck leasing, basic vinyl wraps, and entry-level staffing rates leaves a campaign vulnerable to unexpected municipal fees, overtime labor spikes, and broken supply chains. When field teams run out of product or face compliance citations, the cost per interaction escalates immediately.
Managing a multi-market program requires treating the entire roadshow as an integrated supply chain and sales pipeline. In our experience, campaigns succeed when leaders establish rigid financial controls before the first vehicle leaves the depot. You can review our dedicated mobile sampling tour execution models to see how operational discipline protects campaign capital. Budgeting accurately requires moving beyond surface-level estimations to quantify every variable that influences field performance.
A defensible financial plan groups tour expenditures into ten specific categories. This structure separates fixed overhead from variable field costs, allowing marketing directors to forecast scenarios based on market count, event days, and target sample volumes.
Strategic development covers account leadership, campaign architecture, route modeling, compliance research, and creative asset design. This bucket includes the labor required to build brand training manuals, design spatial floor plans, coordinate retail tie-ins, and manage vendor procurement. It also funds ongoing campaign oversight, weekly client reporting, and crisis management protocols throughout the tour lifecycle.
This category includes vehicle acquisition, monthly lease or rental fees, chassis modifications, and mechanical contingency reserves. It also captures generator systems, shore-power distribution units, commercial refrigeration units, onboard plumbing, and specialized towing equipment. Routine maintenance, fluid checks, commercial parking, and vehicle repositioning fees sit within this category.
Physical production encompasses the exterior vehicle wrap, architectural buildouts, sampling counters, overhead canopies, flags, and display fixtures. It also funds all interior cabinetry, flooring, custom lighting, audio equipment, brand ambassador uniforms, and queue management stanchions. Ongoing maintenance line items must be budgeted here to repair inevitable physical wear during multi-market transit.
Labor costs include the wages, payroll taxes, workers' compensation insurance, and travel per diems for all traveling and local crew members. Roles range from tour managers, lead drivers, and certified food handlers to market managers, brand ambassadors, and media creators. This line item must account for setup hours, teardown hours, product replenishment, and mandatory rest periods.
Direct product costs include the wholesale value of all distributed inventory, test batches, and buffer stock. Consumables cover sanitary sampling cups, branded napkins, utensils, food-grade gloves, sanitizer, and ice. Temperature monitoring tools, staging bins, and cleaning chemicals also reside within this bucket.
Inventory management requires regional warehousing, temperature-controlled storage, cross-docking labor, pallet handling, and local inventory delivery. It includes receiving fees, reverse logistics for excess materials, and secure storage for electronic data-capture devices. Insurance covering warehouse inventory against fire, theft, and temperature excursions must be included.
Transportation covers commercial fuel, highway tolls, bridge fees, trailer repositioning, and local courier services. It includes overnight vehicle parking at secure facilities, driver lodging, flights for staff rotations, and ground transit. Fleet managers must evaluate mileage expenses against standard corporate guidelines, such as IRS mileage benchmarks, to forecast cross-country movements.
Regulatory costs include municipal street vending permits, health department inspection fees, temporary food establishment applications, and park authority access rights. Fire department plan reviews, generator operating permits, and local sales tax registrations fall here. Commercial general liability, commercial auto, inland marine, liquor liability, and umbrella insurance policies are mandatory line items.
Technology expenses fund data-capture hardware, cellular hotspots, offline survey software, and customer relationship management integration. This bucket also includes consumer incentive distribution, fraud prevention software, analytics dashboards, and post-campaign attribution analysis. We integrate physical and digital touchpoints by deploying QR codes and mobile landing pages directly on sampling hardware to capture verified consumer profiles in real time.
Site logistics require dedicated waste disposal, recycling management, greywater pump-outs, and professional post-event cleaning services. Contingency reserves must be allocated for unexpected mechanical breakdowns, extreme weather relocations, and emergency product sourcing. Sound financial governance assigns between eight and fifteen percent of the overall budget to this category.
Selecting a vehicle platform requires balancing capital expenditure against functional capacity. A lightweight trailer may offer lower acquisition costs, but it requires a dedicated tow vehicle, specialized driver licensing, and complex parking maneuvers. A custom Sprinter van provides urban agility, but it offers limited internal storage for high-volume inventory. Heavy step vans and customized mobile kitchens deliver immense presence and storage, but they increase fuel burn and driver wage requirements.
Vehicle costs extend beyond basic rental or lease rates. When calculating cross-country transportation, fleet operators should evaluate baseline travel expenses using established reimbursement and operational standards. For example, the Internal Revenue Service established the standard business mileage rate at 76 cents per mile for the second half of 2026, following a 72.5 cents per mile benchmark during the first half of the year. While specialized commercial vehicles often require higher operating budgets due to fuel consumption and maintenance, these benchmarks provide a baseline for auxiliary fleet transit.
For specialized mobile sampling units, operators must build a dedicated cost equation that isolates fixed equipment from variable operational hours:
A common pitfall is overestimating vehicle utilization. Operating a vehicle six days a week across twelve weeks causes mechanical strain, increases driver fatigue, and elevates the risk of missed activations. A sustainable plan budgets one dedicated maintenance and cleaning day for every three to four active sampling days. This practice preserves asset quality, protects brand reputation, and prevents costly roadside cancellations.
Staffing represents one of the largest variable expenses in any mobile activation. Estimating labor purely on active consumer sampling hours leads to major budget deficits. A six-hour public activation consistently requires ten to twelve hours of total labor per person.
Total shift hours must capture every phase of the daily operational lifecycle:
If a team of four brand ambassadors and one tour manager works an aggregate of fifty labor hours in a day and delivers 1,000 verified consumed samples, the productivity rate is twenty trials per labor hour. Tracking this metric across different markets identifies operational bottlenecks, such as slow product preparation or inefficient queue designs.
Vendor published rates for experiential field staffing vary widely across geographic markets. Industry vendor data indicates that experienced brand ambassadors typically bill between $35 and $90 per hour depending on market tier, specialized certifications, and linguistic capabilities. Food preparation specialists and commercial drivers command higher baseline rates. Budgeting models must clearly separate standard straight-time hours from projected overtime hours caused by transit delays or complex load-ins.
To avoid execution failures, review our guide on logistical contingency frameworks to structure field teams that remain resilient under pressure. Professional staffing models account for mandatory rest breaks, meal compliance, and local labor regulations across every state line.
Inventory management can make or break campaign economics. If a tour carries excessive inventory on the vehicle, fuel efficiency drops, interior space becomes congested, and product damage risks increase. Conversely, carrying insufficient inventory leads to emergency air freight shipments, stockouts during peak event foot traffic, and inflated cost per trial.
Managing perishable food or beverage products introduces cold-chain requirements that alter the budget structure. According to the Food and Drug Administration Food Code, temperature-controlled products must remain within strict thermal boundaries throughout storage, transit, preparation, and distribution. A cold-chain failure does not merely cause inventory loss; it can result in regulatory shutdowns and serious consumer safety liabilities.
Cold-chain budget models must fund:
Calculating the true cost of a product sample requires incorporating all supporting consumables. A beverage brand does not just distribute four ounces of liquid. The full cost per serving includes the liquid, the custom branded cup, the recyclable napkin, the ice, the sanitizer, the food-grade glove, and the labor required to pour it.
A low utilization rate indicates that field teams are over-prepping product that spoils before distribution. Tight inventory controls ensure that product spend directly drives verified consumer trials rather than waste bins.
Experiential marketing leaders frequently assume that distributing free product exempts them from municipal commercial regulations. This assumption leads to impounded vehicles, fines, and cancelled activations. Regulatory bodies treat free product sampling under public health and commercial use codes.
For instance, National Park Service temporary food guidance specifies that an official temporary food establishment permit is mandatory for any organization intending to sell, give away, or sample food to the public on its property. Municipal health agencies across the United States enforce similar rules. The state of Illinois temporary food regulations explicitly require food preparation to occur in approved commercial kitchens or certified temporary facilities, banning all off-site residential preparation or storage.
Navigating compliance requires line-item budgeting for distinct regulatory layers:
Every county or city visited requires a temporary food service application, fee payment, and equipment plan review. High-risk foods requiring temperature control trigger higher permit tiers and mandatory physical inspections before public operation begins.
Positioning a branded vehicle on a public sidewalk, pedestrian plaza, or municipal park requires land-use authorization. These permits often mandate minimum insurance limits, naming local government entities as additional insured parties.
Vehicles operating commercial generators, propane tanks, or deep fryers require fire department plan submittals and on-site safety sign-offs. Budgets must cover certified fire extinguishers, automatic suppression system servicing, and electrical grounding equipment.
Urban centers enforce strict noise ordinances that govern the decibel output of mobile generators and public address systems. Operating without a sound permit can lead to instant shutdown orders from local law enforcement.
Permitting timelines also impact cash flow. Many tier-one cities require permit applications sixty to ninety days before the activation date, often requiring expedited review fees. Marketers planning multi-city routes can consult our guide on route planning and municipal permits to map compliance schedules across jurisdictions.
Executing a high-performing mobile tour requires systematic operational choreography. The following playbook details the critical steps necessary to take a program from initial routing to daily live conversion.
Proving the financial value of a mobile sampling tour requires moving past basic foot-traffic counts. The 2019 Event Marketer Measurement Benchmarking Report indicated that 81% of consumer brands tracked overall event attendance or foot traffic as their primary metric. However, raw foot traffic only measures exposure; it does not measure business impact or financial return.
Marketers must implement a structured performance framework that separates reach, interaction, data capture, and commercial outcomes. The academic Return on Investment in Experiential (ROIE) framework structures measurement across functional, financial, and holistic tiers, establishing weighted targets before field launch to evaluate performance objectively.
A verified trial means a target consumer actually consumed the product under staff observation. It excludes samples handed to uninterested passersby who immediately discard them.
A qualified lead satisfies predefined audience parameters, such as geographic location, purchase intent, and explicit opt-in consent for ongoing marketing communications.
Attributed sales must be isolated using geo-matched retail controls, digital promotional codes, or tracked retailer receipts to eliminate baseline organic demand.
Measuring true Return on Investment requires calculating incremental gross profit rather than topline revenue. High topline revenue can mask an unprofitable activation if gross margins are thin.
For brands focused on consumer adoption, customer lifetime value provides a more complete long-term financial picture:
If a specialty beverage company spends $150,000 on a regional mobile tour and earns a $1.50 gross profit margin per unit sold at retail, the activation must generate 100,000 incremental unit sales across its attribution window to achieve financial break-even on direct product margin alone.
Because direct physical sales during an event rarely cover total tour fabrication and fleet overhead, successful campaigns link field activations directly to regional retail velocity. Review our insights on energy drink sampling programs to see how mobile sampling builds immediate retail velocity and distributor confidence.
A practical worked example illustrates how a fast-growing beverage brand models multi-market tour economics. This scenario outlines a six-market activation schedule covering twelve active event days over a four-week operational window.
The immediate retail contribution margin from 1,200 initial sales generates $9,600 in gross profit ($8.00 margin per unit). Factoring in the projected 90-day repeat purchase contribution of $6.00 per converting customer yields an additional $7,200, bringing total direct margin contribution to $16,800.
On direct immediate sales margin alone, the tour operates at a financial deficit. However, this program serves as the catalyst for broader retail expansion roadshows. The presence of the mobile tour enables regional sales teams to secure shelf placement across 150 regional grocery accounts, driving baseline wholesale inventory volume that delivers long-term profitability. Evaluating the activation solely on immediate sample-to-hand transactions would overlook the broader retail distribution gains.
Budget a minimum of ten to fifteen percent of your total vehicle allocation as an emergency mechanical contingency fund. Maintain an active roadside assistance contract that guarantees replacement commercial vehicles within a four-hour window. Schedule mandatory maintenance rest days every week to inspect cooling units, brakes, and electrical connections before transit.
Yes. Design all interior counters, exterior display wings, and interactive kiosks on modular, standardized subframes. By utilizing interchangeable graphic panels and universal bracket systems, you can amortize the initial structural build costs across multiple multi-week campaigns over several fiscal years.
Cold-chain compliance requires dedicated refrigerated transit vehicles, secondary backup generators, certified regional cold storage warehouses, and digital temperature data logging equipment. These operational requirements typically increase baseline storage, transport, and consumable expenses by twenty to thirty-five percent compared to dry ambient sampling tours.
The most frequent mistake is budgeting only for active, public-facing activation hours while ignoring setup, teardown, transit, administrative compliance, and warehouse handling labor. Incomplete labor modeling results in massive unexpected overtime expenses and rapid operational burnout across field teams.
#

30 Years Experiential & Retail Activation Partner for CPG & Beverage Brands | Multi-Market Demos, Roadshows & Costco/Club Programs That Actually Sell