Planning a multi-city mobile tour often feels like managing a moving logistical puzzle without a clear manual. This guide outlines the exact framework required to plan, staff, route, permit, and execute a nationwide mobile sampling tour that drives verifiable retail pipeline.
Field marketing directors often search for ways to turn scattered mobile sampling efforts into predictable retail velocity. This resource delivers a field-tested operating framework that connects audience selection, municipal compliance, live consumer engagement, and measurable point of sale conversion across every market stop.
The Reality of Field Execution and Road Chaos
A standard mobile marketing activation can turn chaotic within minutes without strict operating discipline. Picture an unseasoned crew arriving at a high-traffic metro footprint at dawn. The generator fails to turn over. The municipal parking coordinator claims the permit documentation is missing an endorsement. Meanwhile, pallets of perishable product sit in a warming vehicle cargo bay while the ambient temperature climbs.
When the footprint finally opens two hours behind schedule, the team focuses solely on raw distribution volume. Brand ambassadors hand out full-size units to anyone walking past without qualifying the consumer or explaining product benefits. Pedestrians grab three samples at once, drop empty wrappers into public bins, and walk away without learning brand names or store locations. By mid-afternoon, the activation has burned through half the weekly product inventory with zero consumer data captured.
Nearby retail partners experience no change in product velocity despite the heavy foot traffic outside. Store managers receive no advance notice of the tour stop, resulting in empty retail shelves while promotional staff tell consumers to purchase inside. At the end of the weekend, executive stakeholders receive an expense report showing thousands of distributed samples alongside zero measurable retail lift.
This operational disconnect occurs when experiential campaigns prioritize visual theater over commercial mechanics. A successful mobile tour requires rigorous field discipline, synchronized supply chain management, and clear retail alignment. Without operational control, a traveling brand tour becomes an expensive exercise in distributing free merchandise to unqualified crowds.
Strategic Tour Architecture and Market Selection
Designing a nationwide mobile tour requires building backward from desired commercial outcomes rather than vehicle aesthetics. Every tour deployment must resolve where target consumers live, where priority retail distribution exists, and how local foot traffic converts into repeat retail sales. Random scheduling creates excessive transit costs and weak retail outcomes.
- Tour Strategy Funnel
- Target Consumer Profiling - Retail Partner Density - Route Efficiency - Live Activation - Retail Sell-Through
Market Role Categorization
A balanced multi-city campaign assigns distinct commercial roles to every planned stop. Segmenting markets prevents teams from applying a generic execution model to regions with completely different retail maturity levels.
- Launch Markets: Regions where product distribution is brand new. The primary objective is establishing initial brand familiarity, driving introductory product trial, and securing early retail velocity for emerging retail accounts.
- Expansion Markets: Established regions with strong retail distribution but low consumer awareness. The tour focuses on driving foot traffic directly into regional grocery, club, or convenience partners to accelerate shelf turn rates.
- Retail Partner Markets: Markets scheduled specifically to support key accounts, such as regional supermarket chains or big-box retailers. Activations occur on retail property or within a two-mile radius to maximize immediate basket conversion.
- Test and Validation Markets: Controlled secondary markets chosen to test messaging variants, different sampling formats, or unique promotional incentives before deploying them across major metropolitan stops.
- Control Markets: Matched demographic territories where no mobile activations take place. These markets provide baseline sales data to isolate and measure the true incremental sales lift generated by the tour.
Market Prioritization Scoring
Selecting market stops requires an objective evaluation system. Marketing leadership must weigh operational feasibility against commercial opportunity before approving any itinerary.
- Market Prioritization Index (MPI) Formula
- MPI (Retail Density x 0.35) (Target Consumer Match x 0.25) (Permit Feasibility x 0.20) (Route Efficiency x 0.20)
- Retail Account Density (35% Weight): Evaluate the total number of authorized retail doors carrying the specific promotional stock keeping units within a five-mile radius of the activation zone.
- Target Consumer Concentration (25% Weight): Analyze regional demographic and psychographic data to confirm alignment with core consumer buyer profiles.
- Permitting and Property Access Feasibility (20% Weight): Assess the difficulty, lead time, and cost associated with securing municipal mobile vending permits and private property rights.
- Route and Cluster Efficiency (20% Weight): Calculate transit mileage, driver rest requirements, and fuel consumption relative to adjacent market activations.
Applying this scorecard eliminates internal bias during route planning. It prevents teams from booking expensive destination stops that lack nearby retail distribution. For teams looking to streamline this process, our guide on route planning and permits made simple provides step-by-step scheduling workflows.
Footprint Tiering Strategy
Not every market stop warrants a full-scale footprint buildout. Establishing tiered operational configurations maintains brand standards while managing labor and transport budgets effectively.
- Tier 1 (Flagship Deployments): Full vehicle footprint, secondary interactive games, multiple sampling bays, dedicated product specialists, and digital data capture stations for major metro festivals or sporting events.
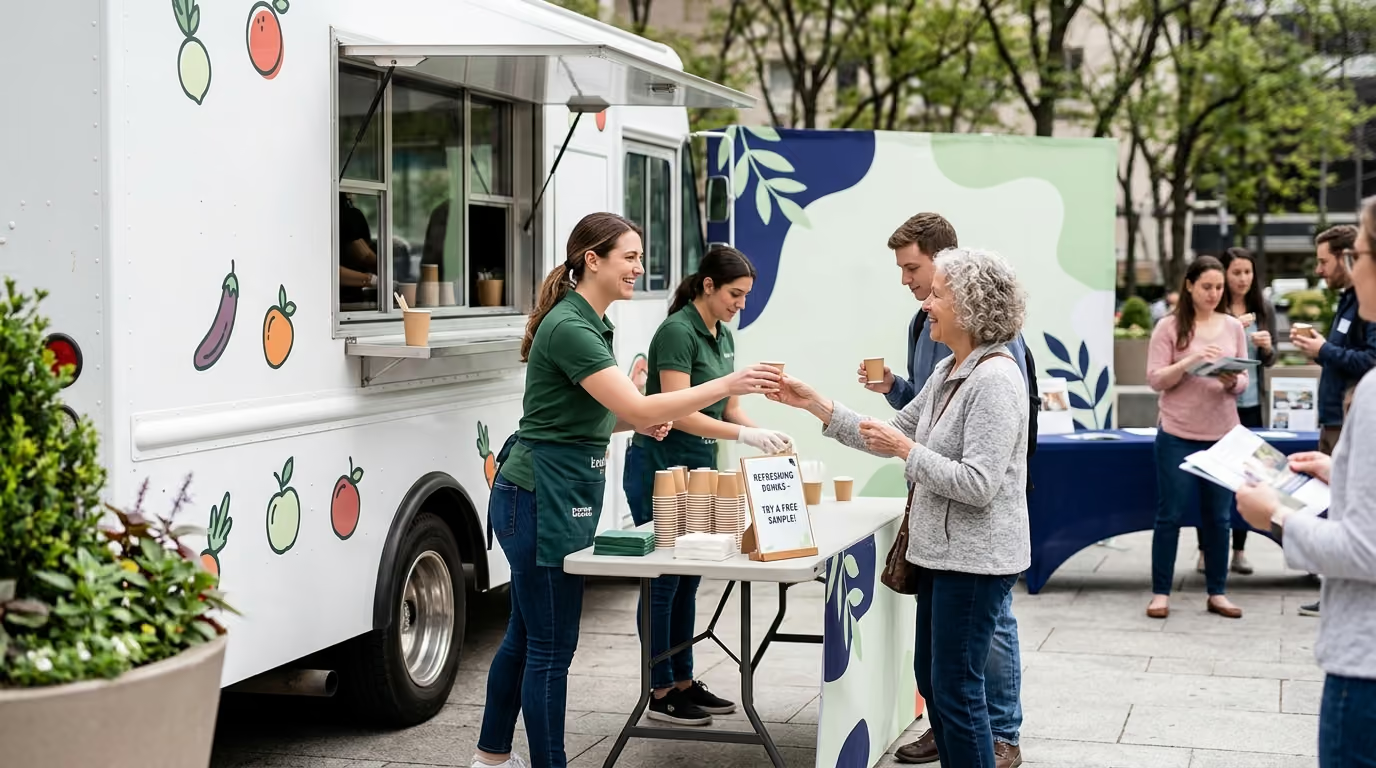
- Tier 2 (Standard Retail and Community Stops): Compact vehicle setup, two sampling stations, branded shade structures, and an active retail direction kiosk positioned near grocery parking fields.
- Tier 3 (Guerilla and Rapid Intercepts): Highly mobile mobile sampling carts or pop-up structures deployed for short windows around transit hubs, office parks, and university corridors.
Tiering ensures field teams do not spend three hours setting up heavy production assets for a two-hour community sampling window. It keeps staff fresh and protects equipment from unnecessary wear.
Retail Readiness and Point of Sale Integration
A mobile sampling campaign without retail alignment wastes commercial momentum. Generating immediate product demand is useless if consumers encounter out-of-stock shelves or confused store managers at the point of sale.
- Retail Integration Workflow
- Inventory Audit - Store Manager Briefing - Geofenced Mobile Offer - Live Trial - Shelf Conversion
The Retail Synchronization Audit
Before a mobile asset arrives in a target territory, the field team must execute a systematic retail readiness checklist across all local stockists.
- Pre-Tour Retail Readiness Checklist
Failing to complete this audit leads to out-of-stock situations that damage retail relationships. Many brands supporting major distribution pushes use dedicated retail expansion roadshows to synchronize field sampling with supermarket inventory deliveries.
Connecting Physical Trial to Digital Conversion
In our experience, successful tours treat physical sampling as the entry point into a connected consumer journey. We blend physical and digital touchpoints by integrating QR codes, mobile engagement tools, and real-world interactions into a cohesive operating layer. This integrated approach connects live trial to measurable retail action without creating friction on the ground.
- Localized Digital Direction: Brand ambassadors present dynamic QR codes that open localized maps showing the exact aisle and shelf location in nearby stores.
- Digital Incentive Delivery: Consumers scan a code to receive an immediate mobile wallet coupon or receipt-rebate offer valid only at local retail partners.
- First-Party Data Capture: Short digital surveys gather product feedback and consumer consent in exchange for branded merchandise or high-value promotional items.
- Geofenced Retargeting: Digital advertising layers reinforce the live interaction by serving reminder ads to consumers who entered the activation footprint.
This connected layer provides clean attribution data. It allows brand managers to see which specific stops generated store visits and verified register redemptions.
Permitting, Municipal Compliance, and Safety Standards
Operating mobile marketing vehicles across public and private jurisdictions requires navigating strict municipal codes. Overlooking local regulations can result in immediate shutdown orders, heavy municipal fines, and public brand embarrassment.
- Permit Verification Timeline
- T-90 Days: Identify Jurisdictions - T-60 Days: Submit Health/Fire Applications - T-30 Days: Secure Certificates of Insurance - T-0: On-Site Inspection
The Comprehensive Permit Matrix
Every market stop must maintain a dedicated compliance file. Field directors should track requirements across multiple regulatory categories before mobilizing equipment.
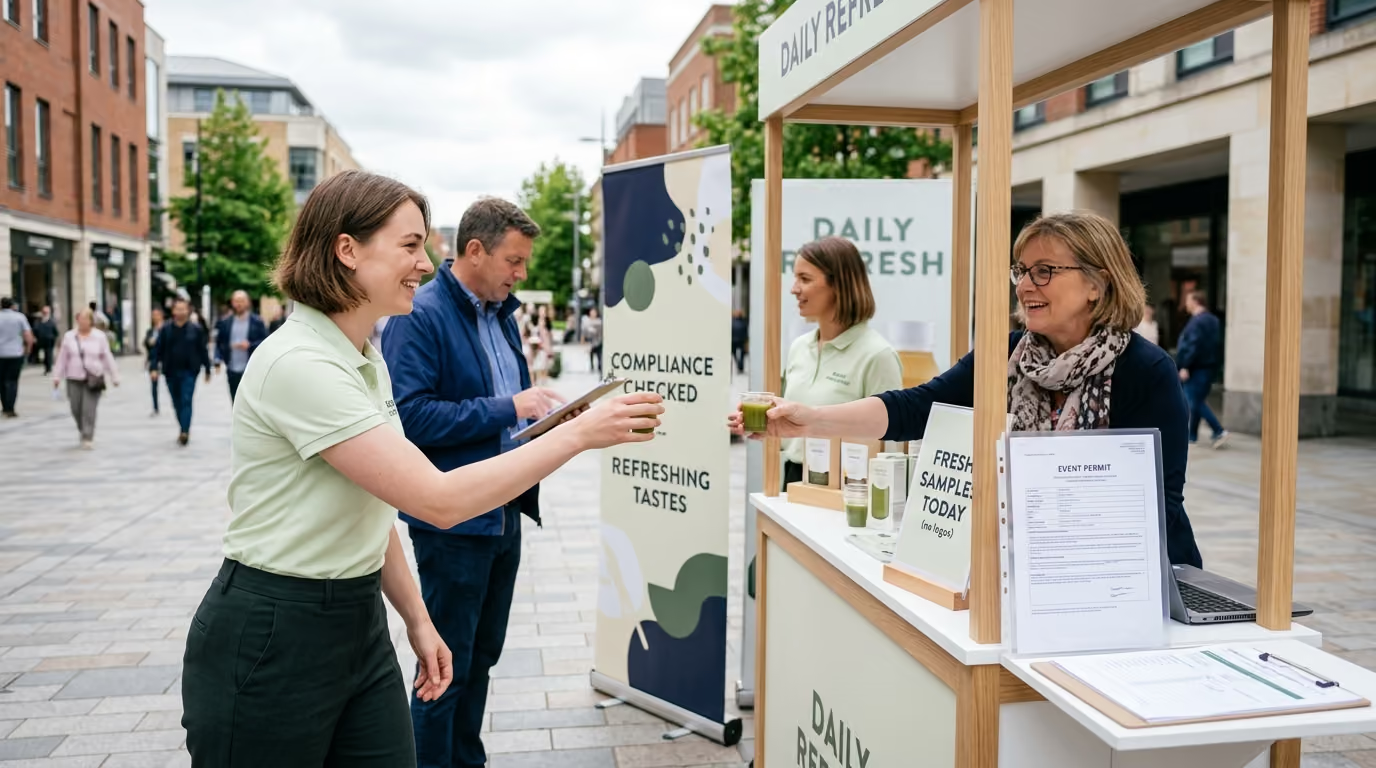
- Public Property and Right-of-Way Permits: Required for city parks, public plazas, boardwalks, and municipal street parking spaces. Lead times range from thirty to ninety days depending on municipal council schedules.
- Temporary Food Establishment Permits: Mandated by local county health departments whenever food or beverage items are opened, prepared, or portioned on site. Regulators inspect cold-holding equipment, handwashing stations, and sanitation setups.
- Fire Marshal Approvals: Necessary when using onboard generators, propane heating systems, or enclosed tent structures exceeding standard square-footage thresholds.
- Special Event Commercial Activity Licenses: Required by many metropolitan business licensing offices to distribute branded collateral or conduct promotional activities in public areas.
- Private Property Access Agreements: Written permission from property management firms, mall operators, or retail property owners specifying insurance liability, power access, and exact operating footprints.
Local authorities administer unique practical requirements based on the Food and Drug Administration (FDA) Food Code. Field teams must confirm specific regulations with state, county, and city agencies for every tour stop.
Food Safety and Allergen Protocols
Distributing edible samples to thousands of consumers requires strict hygiene standards. Packaging and ingredient handling must comply with all federal food safety standards.
- Major Allergen Disclosure: Federal law requires product packaging to clearly identify major food allergens, including milk, eggs, fish, crustacean shellfish, tree nuts, peanuts, wheat, soybeans, and sesame. Original packaging must remain accessible at the footprint for consumer inspection.
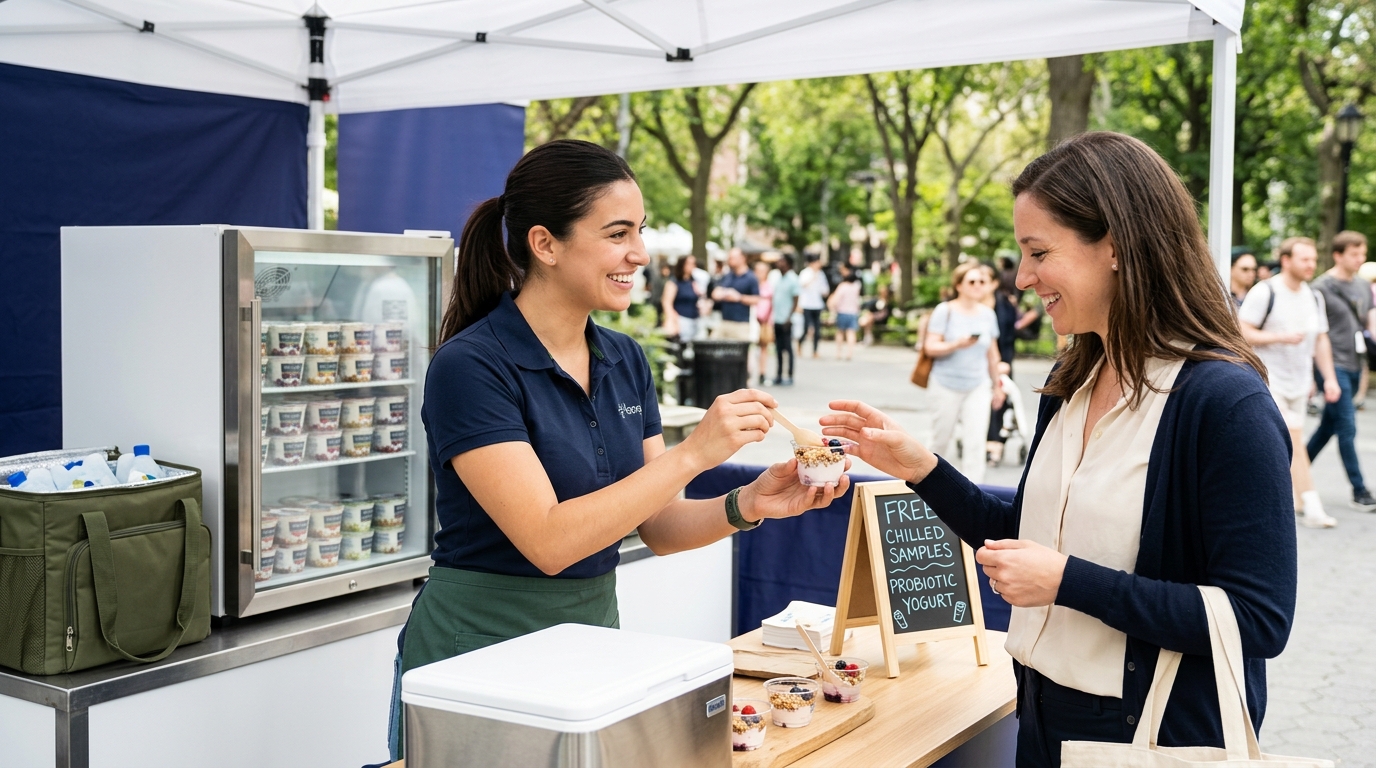
- Temperature Control Logs: Perishable food items must be held at or below 41 degrees Fahrenheit for cold storage or at or above 135 degrees Fahrenheit for hot holding. Field staff must log temperatures every two hours in a digital compliance ledger.
- Sanitation Infrastructure: Footprints handling open food must maintain dedicated handwashing stations equipped with warm running water, soap, single-use paper towels, and a wastewater collection container.
- Cross-Contact Prevention: Dedicated utensils, gloves, and prep surfaces must be maintained for separate product varieties to eliminate cross-contamination risks.
Field staff should never guess when answering consumer questions about ingredients or medical dietary concerns. Staff must direct consumers to official product packaging and avoid making unapproved nutritional claims.
Accessibility and Inclusive Footprint Engineering
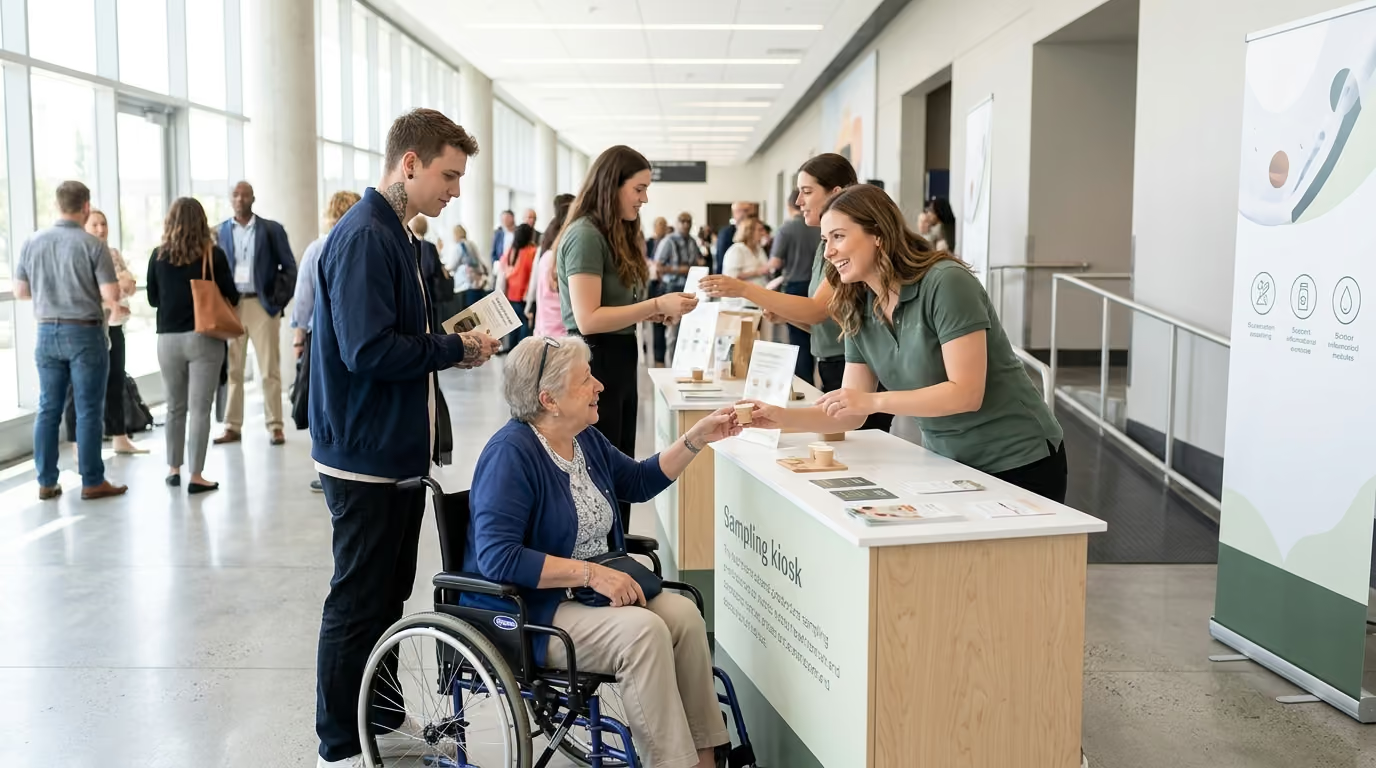
Temporary experiential footprints must comply with Americans with Disabilities Act (ADA) standards. Public accommodations apply directly to temporary event structures, mobile marketing units, and temporary sampling counters.
- Accessible Approach Routes: Provide an unobstructed path of travel across public sidewalks, curb cuts, and parking lots into the activation space.
- Service Counter Heights: Sampling counters and interactive displays must feature a lowered section no higher than 36 inches above the ground to accommodate individuals using mobility devices.
- Queue Navigation: Maintain a minimum clear width of 36 inches throughout all queuing lanes and pedestrian navigation corridors within the activation footprint.
- Sensory and Communication Access: Offer large-print ingredient lists and alternative visual product information to support consumers with diverse communication needs.
Designing accessible footprints from the beginning prevents expensive structural modifications on site and ensures every consumer enjoys a seamless brand experience.
Field Safety and Environmental Protection
Outdoor field operations expose staff and equipment to physical risks, extreme weather conditions, and mechanical hazards. Operating procedures must follow Occupational Safety and Health Administration (OSHA) workplace safety guidelines.
- Heat Illness Prevention: Designate an on-site safety coordinator to monitor local heat index ratings throughout the day. Provide shaded rest areas, mandatory hydration schedules, and electrolyte supplements during periods of high heat.
- Severe Weather Contingency Protocols: Establish defined thresholds for wind speeds, lightning distance, and heavy precipitation that trigger immediate footprint takedown or suspension of operations.
- Ballast and Structural Anchoring: All pop-up canopies and temporary signage must be secured with weighted ballasts meeting minimum engineering standards. Never rely on lightweight tent stakes in urban concrete settings.
- Traffic and Pedestrian Separation: Position physical barriers, stanchions, and safety cones between transport vehicles, active driving lanes, and pedestrian sampling zones.
Maintaining comprehensive safety plans protects field teams and minimizes liability exposure throughout long operating seasons. For operational risk frameworks, review our detailed guide on contingency planning frameworks across live field activations.
Operational Staffing Models and Field Leadership
The success of a mobile sampling tour depends heavily on the execution discipline of the road crew. Well-trained brand ambassadors turn simple product handoffs into memorable, high-converting brand conversations.
- Tour Staffing Hierarchy
- Tour Manager - Assistant Tour Manager / Logistics Lead - Product Specialists - Brand Ambassadors
Team Roles and Operational Responsibilities
A scalable tour requires a clear chain of command. Separating operational duties from consumer-facing engagement prevents logistical bottlenecks during live hours.
- Tour Manager: Directs overall tour execution, manages municipal relationships, oversees the tour budget, handles client communication, and resolves operational emergencies.
- Logistics and Safety Lead: Operates the primary transport vehicle, manages electrical and generator systems, oversees footprint buildout, and enforces site safety standards.
- Product and Sanitation Specialist: Manages product inventory, oversees food preparation standards, maintains temperature control logs, and ensures sanitary sampling conditions.
- Lead Brand Ambassadors: Direct consumer engagement, manage queue pacing, communicate key brand messaging, and assist consumers with digital offer redemption.
- Data Capture Specialist: Monitors survey completion rates, audits QR code performance, and ensures proper end-of-day tally reconciliation.
Calculating Field Labor Requirements
Staffing levels should never be based solely on average daily attendance numbers. Experienced field operators calculate required headcount based on peak hourly consumer throughput.
- Required Staffing Formula
- Staff Headcount (Peak Hourly Traffic x Target Interaction Time in Minutes / 60) Logistics and Break Relief Buffer
- Staffing Capacity Model
- Target Interactions: 240 consumers per peak hour
- Average Interaction Time: 1.5 minutes per consumer
- Engagement Capacity Needed: (240 x 1.5) / 60 6 Active Engagement Staff
- Operational Support: 1 Product Prep Specialist 1 Logistics Lead 1 Break Relief Staff
- Total Required On-Site Headcount: 9 Personnel
Planning for peak operational capacity prevents long consumer wait times, rushed messaging, and staff burnout during high-volume event windows.
Practical Field Training Curriculum
Classroom training alone does not prepare brand ambassadors for the chaos of live field operations. Comprehensive staff onboarding must include active scenario role-playing alongside operational drills.
- The Three-Second Hook: Train ambassadors to deliver clear, welcoming opening statements that capture attention without obstructing foot traffic flow.
- The Single Core Message: Focus consumer conversations on one primary benefit and one distinct reason to believe rather than overwhelming prospects with extensive feature lists.
- Active Qualifying Techniques: Teach staff to ask simple qualifying questions before handing out samples, ensuring product reaches genuine category consumers.
- Direct Point of Sale Direction: Train staff to end every positive interaction with specific instructions on where to purchase the product in nearby retail accounts.
- Allergen and Crisis Escalation: Practice exact standard operating procedures for handling consumer dietary questions, intoxicated individuals, and site medical emergencies.
Equipping teams with practical conversation frameworks ensures consistent message delivery across every market stop.
Live Field Implementation and Daily Management
Flawless tour execution requires strict adherence to standardized daily checklists. High-performing road teams execute repeatable standard operating procedures from initial morning setup through evening equipment securement.
- Daily Operational Workflow
- 06:00 Site Arrival - 08:30 Staff Briefing - 09:00 Footprint Live - 17:00 Closeout - 18:30 Daily Recap
Step-by-Step Field Execution Playbook
Executing a mobile tour stop requires meticulous coordination. The following chronological guide outlines the exact tasks required to run a high-volume sampling activation.
- Step 1: Morning Site Positioning and Staging (T-180 Minutes)
* Inspect the designated footprint area for overhead obstructions, uneven pavement, and safety hazards.
* Position the primary vehicle or trailer according to pre-approved site layouts and municipal access requirements.
* Deploy safety cones and establishing a secure perimeter around the vehicle staging zone.
- Step 2: Utility Infrastructure and Structural Buildout (T-120 Minutes)
* Connect primary shore power or establish secure, grounded generator connections with proper ventilation.
* Erect branded shade structures, anchoring each leg with commercial-grade ballasts.
* Assemble sampling service bars, interactive displays, and queuing stanchions.
* Verify accessible travel paths and confirm compliance with ADA counter height standards.
- Step 3: Food Preparation and Hygiene Verification (T-60 Minutes)
* Sanitize all food-contact surfaces using approved food-grade sanitizing solutions.
* Set up primary handwashing stations with warm water, antibacterial soap, and single-use towels.
* Audit product inventory and record initial cold-holding temperatures in the daily safety log.
* Prepare initial sampling batches according to strict portion control and presentation guidelines.
- Step 4: Morning Team Briefing and Calibration (T-30 Minutes)
* Review daily sample distribution targets, scheduled peak traffic windows, and weather forecasts.
* Confirm individual staff assignments across sampling bays, queue management, and data capture.
* Review local retail partner addresses and verify active promotional discount codes.
* Perform a dry-run operational test across all mobile data capture tools and QR code destinations.
- Step 5: Live Footprint Management and Engagement (Live Hours)
* Maintain proactive consumer greeting and qualifying pacing along the perimeter boundary.
* Deliver clean, portioned samples while communicating primary product benefits and usage occasions.
* Guide consumers to scan localized QR codes for digital offers and retail store directions.
* Conduct hourly temperature checks, surface sanitizations, and trash disposal sweeps.
* Rotate field staff through scheduled cooling, hydration, and meal breaks.
- Step 6: Evening Footprint Teardown and Sanitation (T+30 Minutes Post-Close)
* Secure all remaining promotional inventory and return perishable goods to refrigerated storage.
* Thoroughly clean, sanitize, and dry all food preparation equipment and service hardware.
* Dismantle temporary structures, signage, and display elements, packing them securely for transit.
* Perform a comprehensive site cleanup, removing all event-generated trash and debris from the property.
- Step 7: Daily Reconciliation and Reporting (T+90 Minutes Post-Close)
* Reconcile physical sample inventory against reported engagement tallies and digital scans.
* Document local weather patterns, peak foot traffic windows, and any operational friction points.
* Submit daily recap reports, high-resolution footprint photographs, and retail feedback to central stakeholders.
Following this structured playbook ensures operational consistency regardless of local site conditions. Brands interested in end-to-end management can explore our dedicated mobile sampling tour execution capabilities.
Performance Measurement and Attribution Systems
Evaluating tour success requires measuring verified business impact rather than relying on vanity metrics. Brand managers must track the entire consumer journey from physical sample acceptance to long-term retail repeat purchase.
- Consumer Conversion Funnel
- 1. Footprint Reach - 2. Qualified Trial - 3. Brand Comprehension - 4. Retail Conversion - 5. Repeat Purchase
The Performance Metric Framework
A balanced measurement scorecard tracks activity metrics, engagement quality, immediate commercial conversion, and long-term brand retention.
- Tour Performance Scorecard
- Lead Metrics (Operational Execution)
- Operational Hours: Total active sampling time versus scheduled operational time
- Qualified Interaction Rate: Percentage of stopped consumers who match the core audience profile
- Trial Rate: Percentage of offered samples actually consumed on site
- Digital Conversion Rate: Percentage of sampled consumers scanning QR codes or completing surveys
- Lag Metrics (Commercial Return on Investment)
- Retail Sales Lift: Percentage increase in retail unit movement during activation windows
- Offer Redemption Rate: Percentage of distributed digital coupons redeemed at local retail doors
- Customer Acquisition Cost: Fully loaded tour expense divided by verified new customer count
- Repeat Purchase Velocity: Percentage of acquired consumers making a secondary purchase within 60 days
Attribution Formulas for Return on Investment Reporting
Evaluating the commercial Return on Investment (ROI) of a nationwide tour requires precise financial modeling. Brand teams should apply consistent mathematical formulas across all tour markets.
- Core Analytical Formulas
- Qualified Trial Rate
- Qualified Trial Rate (Samples Consumed by Target Profile / Total Samples Distributed) x 100
- Cost Per Qualified Trial (CPQT)
- CPQT Total Market Tour Operating Cost / Total Verified Qualified Trials
- Retail Sales Lift (RSL)
- RSL ((Activation Period Unit Sales - Baseline Unit Sales) / Baseline Unit Sales) x 100
- Customer Acquisition Cost (CAC)
- CAC Total Fully Loaded Tour Cost / Total Attributed First-Time Retail Purchasers
Separating self-reported consumer intent from observed retail behavior is essential. While consumer surveys provide helpful sentiment data, true commercial success is proven through scanner data, coupon redemptions, and retailer reorder activity.
Industry Benchmark Insights
Historical industry studies provide helpful context for evaluating mobile tour performance. Research from Arbitron and Edison Media Research indicated that 35% of consumers surveyed reported purchasing a sampled product on the same day they tried it. Furthermore, 58% of respondents stated they intended to buy the sampled product again in the future.
The same research revealed that 24% of consumers bought the sampled item instead of the product they originally planned to purchase. This shows that live product trial can drive direct brand substitution at the shelf. Historical studies from EventTrack also found that trying a product firsthand serves as a primary purchase driver for consumers participating in live brand experiences.
However, academic research published in marketing journals warns that high trial rates do not automatically produce high conversion rates. Product sampling influences ongoing buying habits only when consumers actively use the sample and understand the product proposition. Indiscriminate distribution without consumer education results in poor conversion efficiency.
Real-World Tour Deployment and Retail Lift
To understand how these operational frameworks function in live environments, examine how an emerging packaged snack brand deployed a coordinated mobile sampling tour to support a major grocery expansion.
The Emerging Brand Challenge
An emerging better-for-you snack brand secured new retail distribution across 450 supermarket doors throughout the Mid-Atlantic region. While the brand achieved initial shelf placement, velocity remained sluggish due to low consumer awareness and competitive category clutter. The marketing team needed to drive immediate product trial, educate consumers on premium ingredients, and generate measurable retail sell-through within a tight eight-week window.
- Case Study Snapshot: Better-For-You Snack Retail Expansion Tour
- Markets Covered: 6 Major Mid-Atlantic Metro Areas
- Tour Duration: 8 Consecutive Weeks (Thursday through Sunday Operations)
- Vehicle Assets: Two Custom Tier-2 Sampling Sprinter Units
- Total Verified Qualified Trials: 78,400 Target Consumers
- Average Same-Day Retail Sales Lift: 38.5% Across Target Supermarket Accounts
- 60-Day Repeat Purchase Rate: 22.4% Verified via Digital Loyalty Tracking
The Integrated Field Solution
The brand partnered with our field marketing team to execute a synchronized mobile tour targeting high-density grocery corridors. Using the Market Prioritization Index, the team mapped 32 high-traffic suburban zones located within a two-mile radius of priority retail accounts. The deployment strategy focused on precision execution rather than broad, unfocused sampling.
- Synchronized Retail Footprints: The mobile team activated in supermarket parking plazas and nearby community spaces, ensuring consumers were never more than five minutes away from an authorized retail door.
- Structured Brand Engagement: Brand ambassadors engaged consumers using a three-point messaging framework highlighting taste, clean ingredients, and local store availability.
- Connected Digital Incentives: Consumers scanned a custom QR code on the sampling tray to receive an instant digital mobile coupon redeemable exclusively at the neighboring supermarket.
- Real-Time Stocking Collaboration: Field managers maintained direct daily contact with local grocery department managers, providing inventory alerts whenever sampling volume increased foot traffic.
This structured approach proved highly effective. The brand achieved an average 38.5% increase in weekly unit movement across participating grocery accounts compared to pre-tour baselines. Digital coupon redemption reached 14.2%, and 60-day customer tracking demonstrated a 22.4% repeat purchase rate. For more detailed snack execution strategies, review our analysis on how emerging snack brands scale retail sampling to accelerate store velocity.
Immediate Implementation Checklist
Applying this mobile sampling framework requires systematic preparation. Use this practical implementation checklist to guide your campaign planning over the next seven days.
- Week 1 Implementation Checklist
Building a high-performing mobile sampling tour requires discipline, operational precision, and seamless retail synchronization. When physical trial connects directly to nearby retail shelves, a mobile tour becomes a reliable engine for scalable brand growth.
#
Sources
- U.S. Department of Justice ADA Title III Regulations
- U.S. Department of Justice 2010 ADA Standards for Accessible Design
- Occupational Safety and Health Administration Heat Exposure Guidelines
- Occupational Safety and Health Administration Heat Safety Planning
- Alcohol and Tobacco Tax and Trade Bureau Tied-House Guidance
- U.S. Food and Drug Administration Food Allergen Labeling and Consumer Protection Act Guidance
- MarketingCharts Summary of Arbitron and Edison Media Research Sampling Study