Robbie Thain
Founder, CEO
Move past vanity metrics. Learn the 5 key data points to prove retail sampling Return on Investment and turn event foot traffic into measurable revenue.

Measuring event success by the number of samples handed out is a guaranteed way to lose your marketing budget. This guide breaks down the exact revenue-focused metrics you need to prove live brand activations directly drive retail sales.
The pallets arrived late. The brand ambassadors are scrambling to prep the booth. Thousands of people walk by and grab a free sample without stopping. When the doors close you have empty boxes but zero proof that anyone actually bought the product.
This is the standard trade show trap. We see it constantly when brands launch new products or execute a massive retail push. Teams track headcount and consider it a massive victory when they run out of inventory. Headcount is just a vanity metric that creates an illusion of success.
If a thousand people try a beverage but retail sell-through remains flat, the event failed. Marketers face immense pressure to justify their budgets with hard financial data. Counting empty sample cups does not build retailer confidence or secure future investment. The executives holding the budget want to see a direct link between the experiential spend and the quarterly revenue targets.
Every time a field team reports only the number of interactions, they leave money on the table. Retail buyers are ruthlessly protective of their shelf space and demand real performance data. They do not care how many people smiled at your brand ambassadors. They only care about velocity, conversion rates, and repeat purchases.
You need a systematic shift from tracking volume to tracking actual financial outcomes. Marketing experts emphasize that mapping key performance indicators to each stage of the funnel enables clearer performance attribution. The goal is to build an evidence-based reporting framework for every single activation. By combining accurate multi-touch attribution with complete cost data you can calculate the true Return on Investment of every campaign.
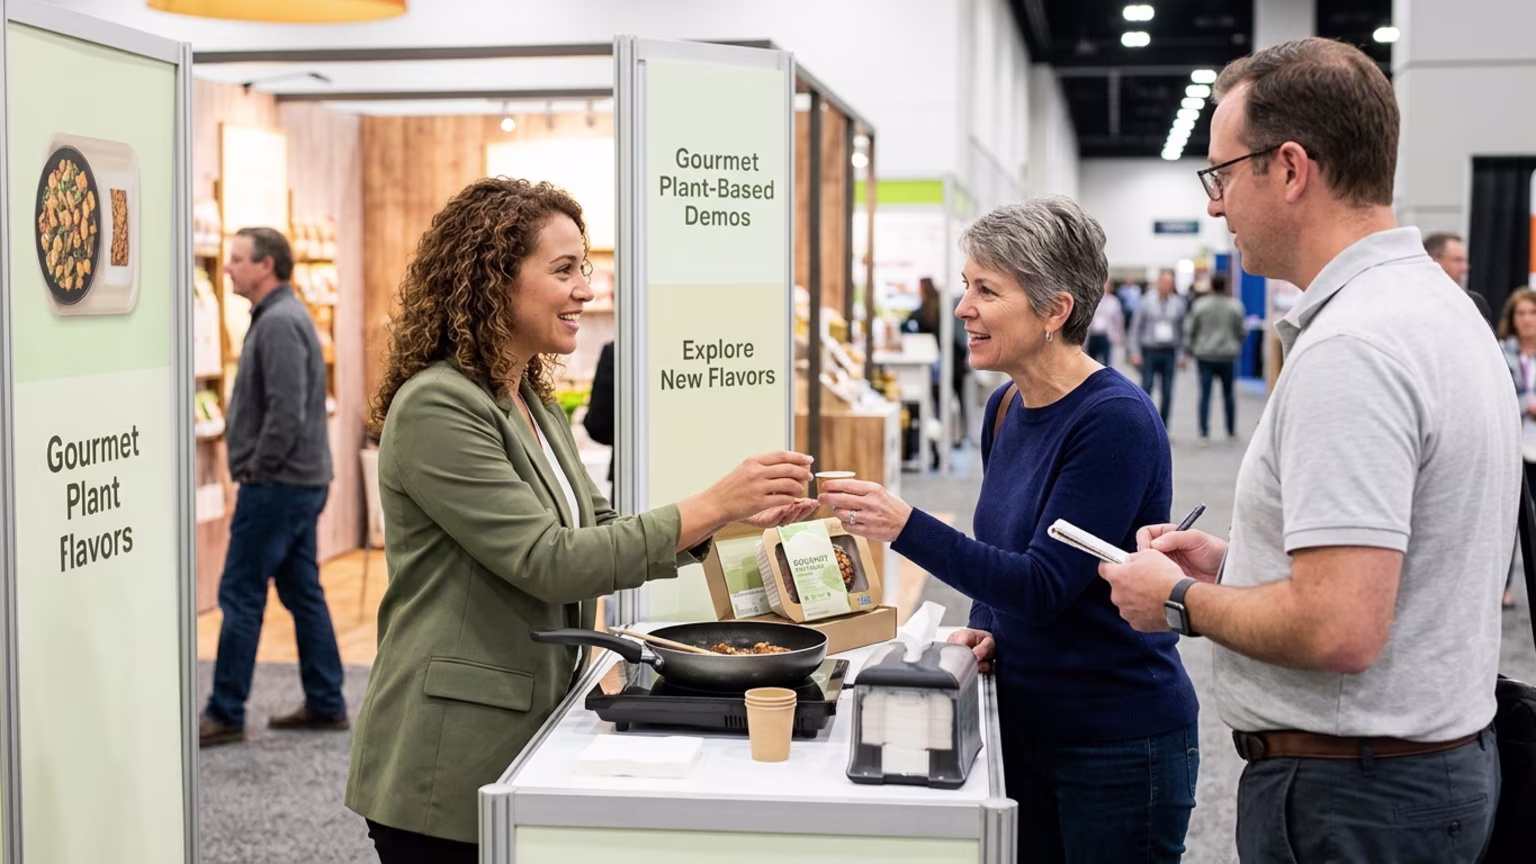
We specialize in creating retail demos, product sampling programs, and roadshows that bring brands face to face with their audiences. We never rely on foot traffic alone. Every single interaction must tie back to a measurable business goal. This strict discipline turns a chaotic consumer event into a predictable revenue engine.
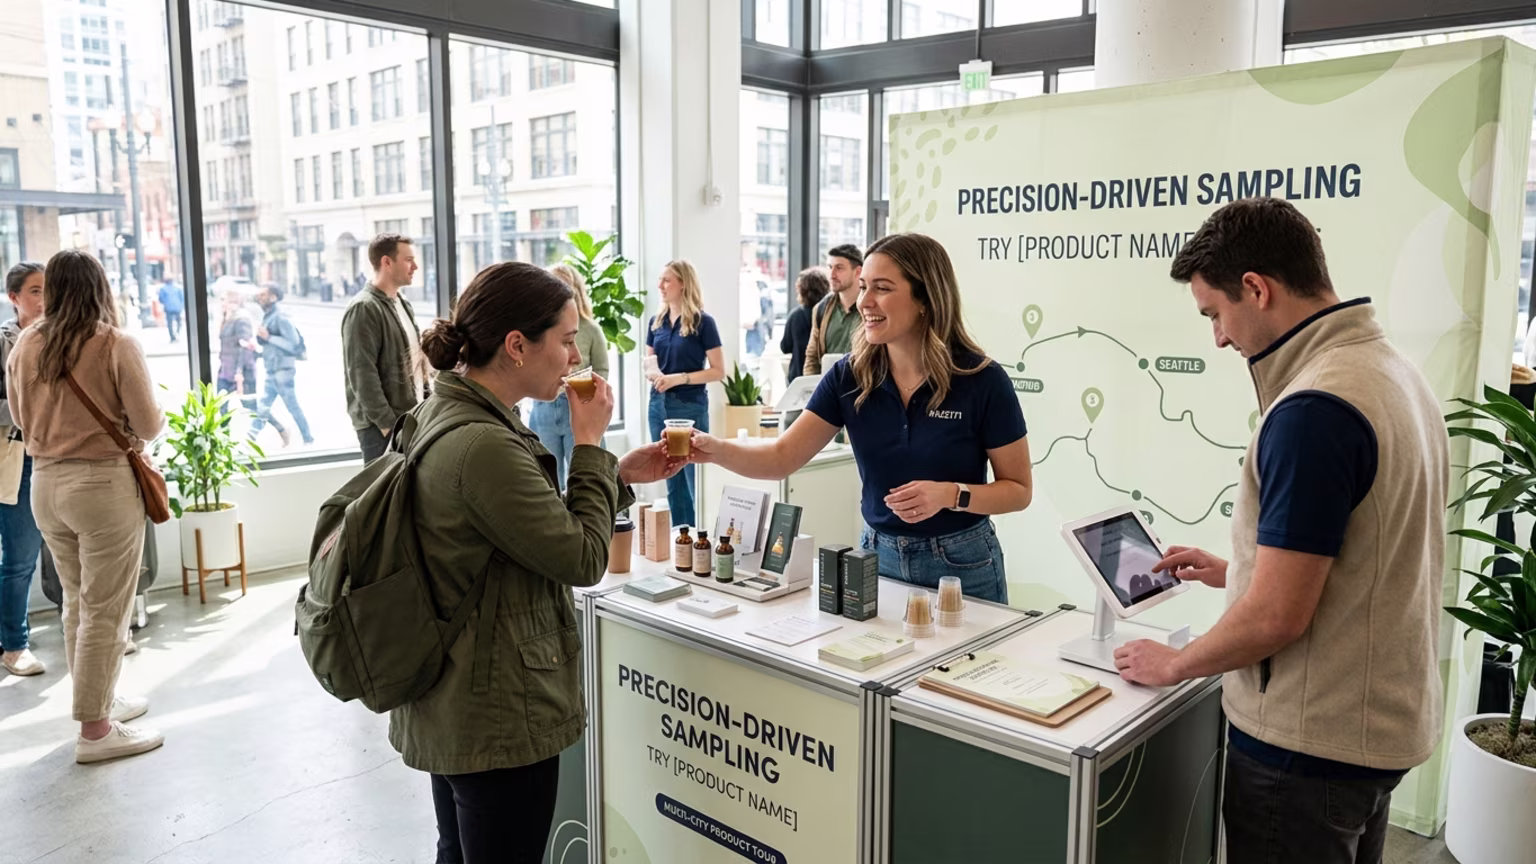
Industry analysts point out that 70 percent of marketing leaders are now adopting multi-touch models. This method links street activations directly to retail checkout velocity. You can turn your trade show sampling into retail pipeline velocity by aggressively tracking these data points. Without unified analytics you will always struggle to prove value to your stakeholders.
Tracking outcomes requires planning for external factors that can dilute your results. Case studies show up to a 25 percent variance in success based purely on in-store presentation. The best activation will fail if the retailer fails to stock the shelves properly. Your strategy must account for the entire journey from the street to the register.
You cannot wait until the event ends to figure out your measurement strategy. It requires operational discipline before the first sample is ever poured. To secure funding for future initiatives you must redefine event success metrics beyond attendance.
Without a unified system, multi-touch models suffer from significant inaccuracy caused by data silos. You need complete visibility to see the direct path from a physical trial to a retail checkout. This playbook provides the foundation for accurate reporting. A consistent execution strategy builds trust with the retail partners who control your distribution.
When it is time to report back to leadership, these are the exact figures that matter. Measuring profit from activities as a percentage of your initial investment is the ultimate test. Focus your reporting entirely on these five performance indicators.
Net Promoter Score quantifies customer loyalty immediately after the activation. Industry benchmarks show that top experiential campaigns hit an NPS of 50 or higher. This high score directly correlates with repeat purchases and long-term brand affinity. Keep in mind that scores will decay 20 to 30 percent over time without proper follow-up.
This measures the percentage of new revenue generated directly by marketing efforts. During roadshows, marketing-generated leads often convert to a massive portion of new revenue when tracked properly. Data shows a 20 to 30 percent revenue link from physical activations when mapped accurately. This level of attribution proves that your field team is moving product off the shelf.
It is critical to measure how many samplers actually become paying customers. In the beverage and snack categories, strong activations capture contact information from up to 20 percent of foot traffic. Research shows that 40 percent of those captured leads can convert to sales within 30 days. You must link your event data to an active CRM to see this true conversion rate.
Experiential marketing should make it cheaper to acquire a loyal buyer. A lifetime value to acquisition cost ratio above three to one easily justifies your sampling budgets. Direct product trials frequently lower the cost of acquisition by 15 to 25 percent. The payback period for this investment must remain under 12 months to satisfy quarterly financial scrutiny.
If you are running wholesale activations, track your win rate on qualified opportunities. High quality physical product demos yield win rates between 25 and 35 percent. This significantly outperforms digital channels since face to face interactions build trust quickly. Tracking these signals allows your sales team to resonate with and close prospects much faster.
Consider a recent consumer packaged goods brand launching a new health product. They needed to prove retail demo success beyond vanity metrics to maintain their premium shelf space during a critical massive retail push. The brand faced intense pressure to show immediate sales lift after a costly nationwide rollout.
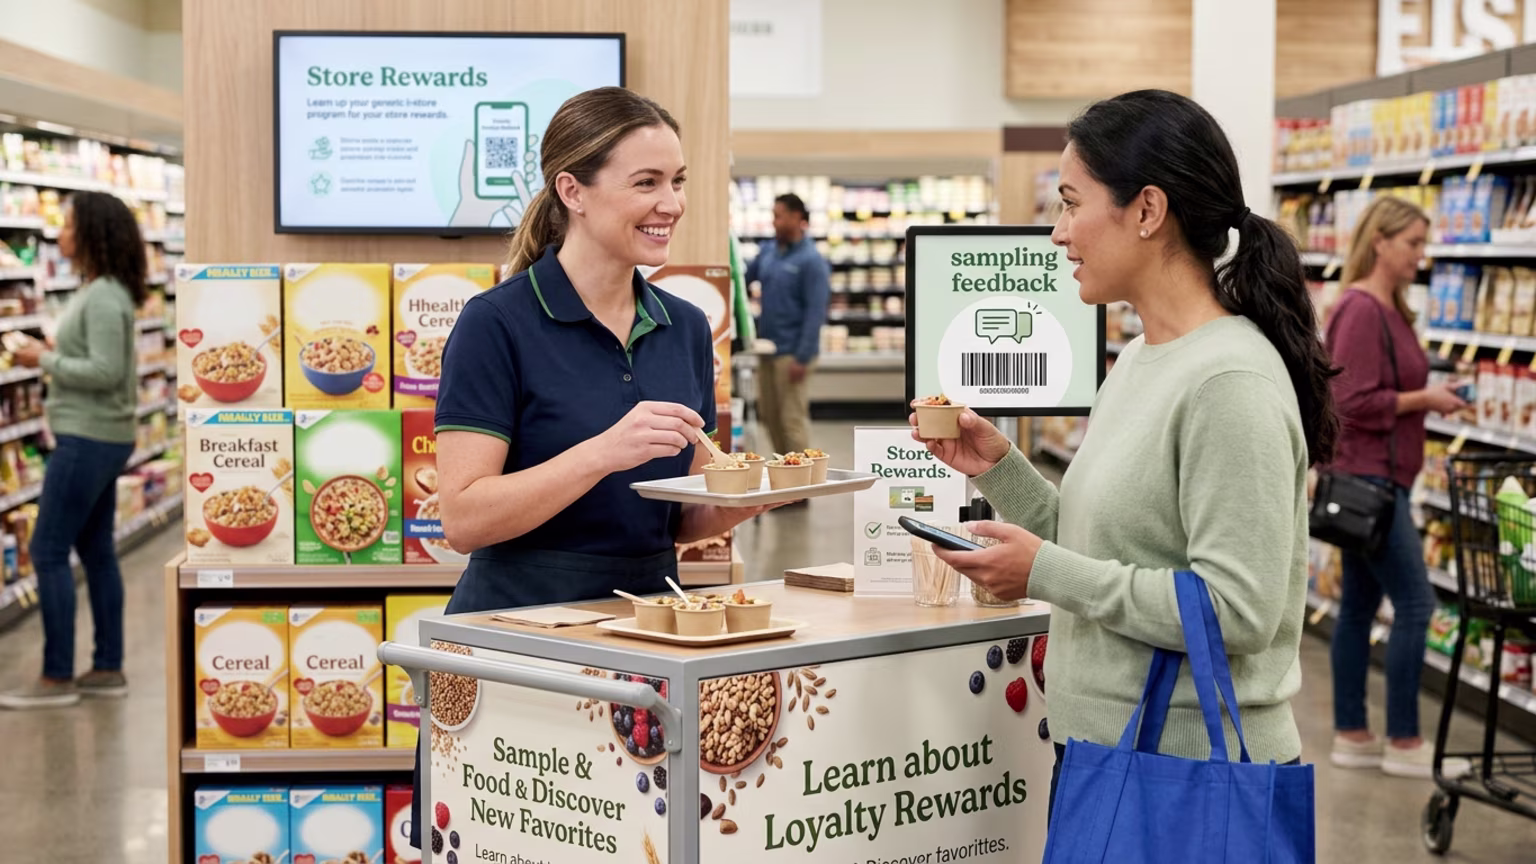
Instead of just logging the number of interactions, the team implemented a mini calculator formula tracking time saved, staff costs, and actual revenue lift. By linking the in-store demo directly to a post-event digital coupon, they proved a 25 percent lift in regional sales. The data revealed that a post-sampling customer retention rate exceeded 80 percent for shoppers who rated the experience highly. They presented this clear data to the retailer and secured a massive regional expansion.
Stop accepting vague event reports and demand that your next activation connects every single sample to a measurable retail outcome. Book a strategy call today to build an evidence-based experiential program.

30 Years Experiential & Retail Activation Partner for CPG & Beverage Brands | Multi-Market Demos, Roadshows & Costco/Club Programs That Actually Sell

Since 1995, Makai has been connecting brands with people through live experiences, retail programs, and national activations.