Robbie Thain
Founder, CEO
Marketing leaders need data-driven proof that sampling events drive sales. Learn five key metrics and attribution models to prove retail demo ROI.

Retailers see a twenty-five percent dwell time increase in high-margin areas when layouts and demos are optimized with visitor analytics. Traffic alone means very little without targeted engagement. You need actionable intelligence to turn those lingering shoppers into verified sales.
Marketing leaders require data-driven proof that sampling events drive tangible sales lift and repeat purchases. This guide outlines the exact performance metrics and attribution models you need to secure executive buy-in for physical activations.
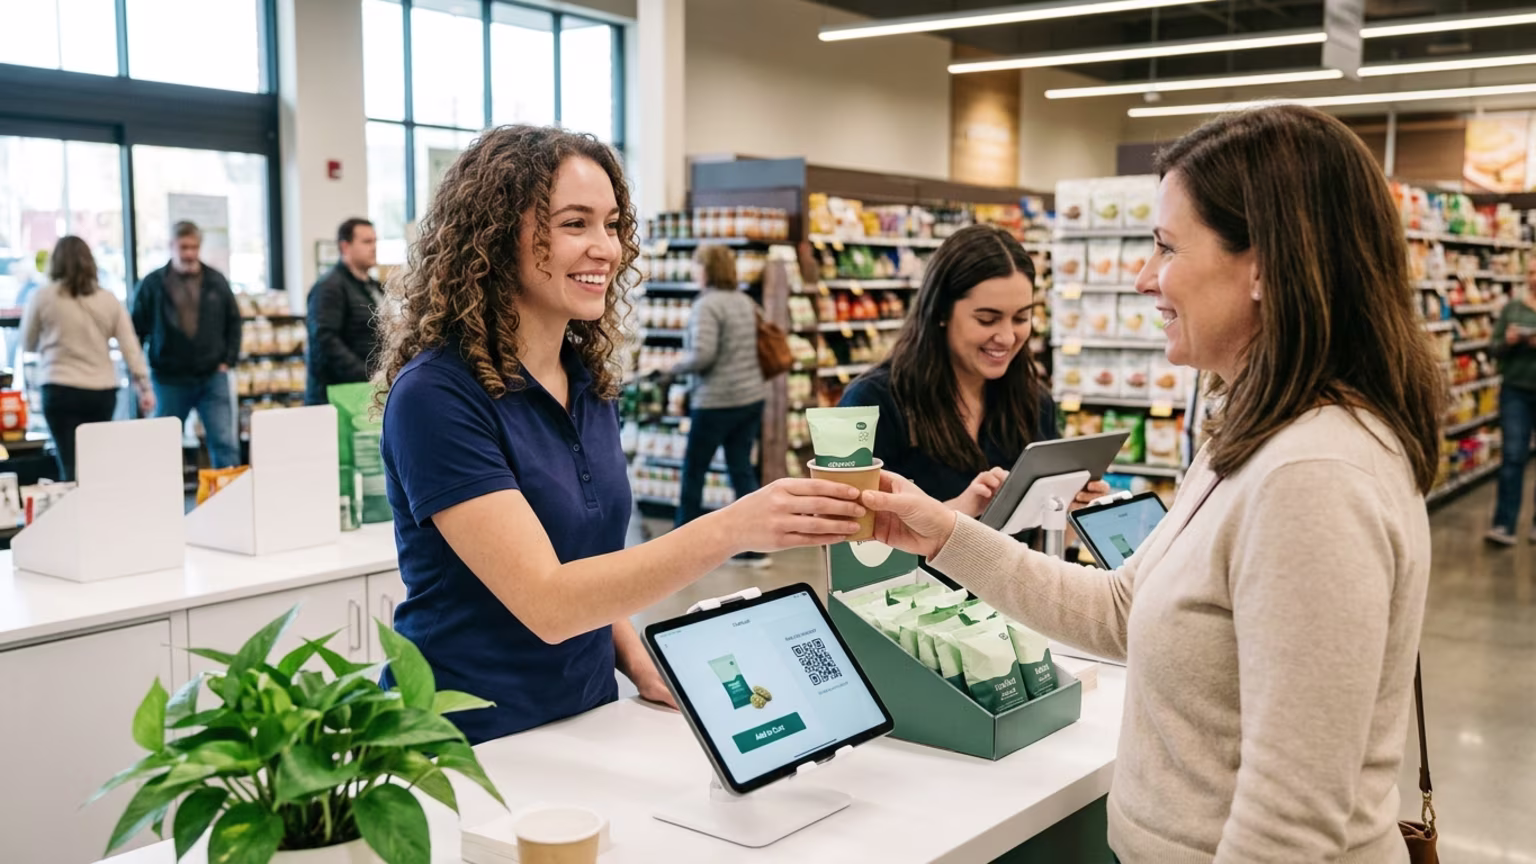
You launch a new product and secure a premium endcap. The store feels packed with weekend shoppers. Your field team hands out hundreds of samples and scans the crowd for the next interaction. The event looks incredibly busy to the naked eye.
Then Monday morning arrives. Your leadership team asks for the Return on Investment (ROI) from the weekend activation. You report the number of samples distributed and the estimated foot traffic. The Chief Marketing Officer nods but immediately asks how many of those samplers actually bought the product.
Silence fills the room. Raw foot traffic numbers are just the starting point. High volume can easily mask low conversions or short dwell times that signal poor engagement. When you only measure samples handed out, you produce fog instead of evidence.
This is the floor reality for many mid-market consumer brands. Field marketing budgets are under intense pressure from finance teams. The days of justifying a retail activation based purely on brand awareness are over. You need concrete numbers to keep your programs funded.
Performance-driven teams use strict marketing measurement to tie every campaign dollar to tangible sales. We specialize in creating retail demos, product sampling programs, and roadshows that bring brands face to face with their audiences. Each program is designed to drive trial, build consumer relationships, and accelerate retail velocity across multiple locations. You need a systematic approach that links experiential activations to actual outcomes.
This requires moving past vanity metrics and integrating point-of-sale data with activation reporting. Leading analysts note that closed-loop attribution now sets the bar for retail intelligence. When you combine visitor counts with purchase data, you create undeniable proof of performance.
Modern tools allow teams to track mobile identifiers and connect physical interactions to digital loyalty programs. You can monitor the exact uplift of adjacent products when you cross-merchandise during a demo. A strong CPG sampling strategy aligns these data points to build a clear narrative for your retail buyers. This methodical tracking separates operator-grade execution from amateur brand theater.
Modern experiential marketing relies on a specific set of measurement tools. First-party data from loyalty programs forms the foundation of your reporting. You then layer on point-of-sale information to track immediate transaction volume. Finally, you integrate footfall analytics tools to measure physical movement within the store.
Relying on just one of these systems leaves dangerous gaps in your knowledge. A robust reporting dashboard pulls from all three sources simultaneously. This alignment helps you avoid the common pitfalls that plague many consumer brands. Ignoring this combined data is one of the biggest mistakes brands make after securing retail distribution.
Transforming a standard product sampling event into a measurable growth engine requires strict operational discipline. You need a clear process to capture data before the first sample is even poured. Here is how our team executes this strategy in live environments.
These steps allow you to optimize staffing and layouts quickly. Quick wins from footfall analytics include labor cost reductions via peak-hour staffing optimizations. Measurable improvements in staffing efficiency often appear within four to eight weeks. If you want to build this operational discipline, book a strategy call with our field experts.
Executing this data strategy at a single grocery store is a manageable task. Scaling it across fifty locations simultaneously requires severe operational discipline. You must train every brand ambassador to execute the exact same tracking protocols. Consistency across your field team determines the accuracy of your final report.
This is especially true during high volume campaigns like Costco roadshows. We manage end to end Costco roadshows that bring brands to shoppers through live demos, real conversations, and measurable sales impact. The sheer volume of traffic demands real-time ratios over daily averages. Overstaffing from unexpected traffic spikes erodes margins very quickly.
You must monitor the passerby to walk-in ratio continuously throughout the day. This metric tests the visibility and pull of your storefront display. If thousands of people walk by but few stop, your visual merchandising is failing. Immediate adjustments based on this ratio will save your activation ROI.
You need specific performance indicators to prove that your live brand experiences convert. These five metrics translate physical engagement into the language of finance and growth.
Conversion rate is the single most important metric for retail profitability. This measures the percentage of visitors who interact with your brand ambassador and then make a purchase. Leading grocers report ten percent higher conversion rates on location-based offers tied to zone analytics. You track this by matching timestamped demo interactions with point-of-sale receipts.
A high conversion rate proves that your product resonates with the target demographic. It validates your messaging and confirms that your brand ambassadors are actually selling the item. If foot traffic is high but conversion is low, you have an engagement problem. You must fix the pitch or change the product presentation immediately.
A successful demo does not just sell the primary product. It increases average basket size when you pair it with cross-merchandising. If you sample a premium salsa, you must track the corresponding sales lift in tortilla chips. Basket analysis provides a more complete picture of your total value to the retailer.
Retail buyers love brands that lift the entire category. When you prove that your activation drives multi-product purchases, you become a strategic partner. This data is incredibly persuasive during your annual vendor reviews. It shows that your presence on the floor generates broad revenue growth.
Dwell time measures how long a consumer stays in your immediate activation area. Retail analysts recommend tracking this metric closely. Longer dwell time correlates with higher purchase probability. A high bounce rate under sixty seconds flags a poor first impression or a weak display.
You can deploy AI heat maps to track these hotspots in real time. This technology reveals exactly where shoppers linger and where they abandon the aisle. Once you know these patterns, you can optimize your store layout immediately. You can place high-margin products on the most popular routes to maximize return.
Immediate sales matter, but lifetime value dictates long-term success. Tracking loyalty enrollment serves as a proxy for repeat buys. When brand ambassadors convert a casual taster into a loyalty program member, they create a permanent digital connection. This metric proves that your field events generate lasting consumer relationships.
Capturing consumer data at the point of trial is incredibly valuable. Tracking this conversion is one of the key metrics every field marketing leader needs to justify continued investment. It allows you to segment shoppers by lifestyle and retarget them later. This ongoing communication turns a single event interaction into a recurring revenue stream.
Return on Ad Spend for physical events requires matching mobile identifiers to store visits. Fintech tools like card-linked offers now subsidize demo discounts and track redemptions automatically. This closed-loop tracking links out-of-home experiential exposures directly to in-store transactions. It provides undeniable evidence that your activation drove the final purchase.
This level of tracking removes all the guesswork from your reporting. You can compare the purchasing behavior of exposed shoppers against a control group. This proves the exact incremental lift generated by your physical marketing efforts. Your Chief Financial Officer will appreciate this rigorous financial reporting.
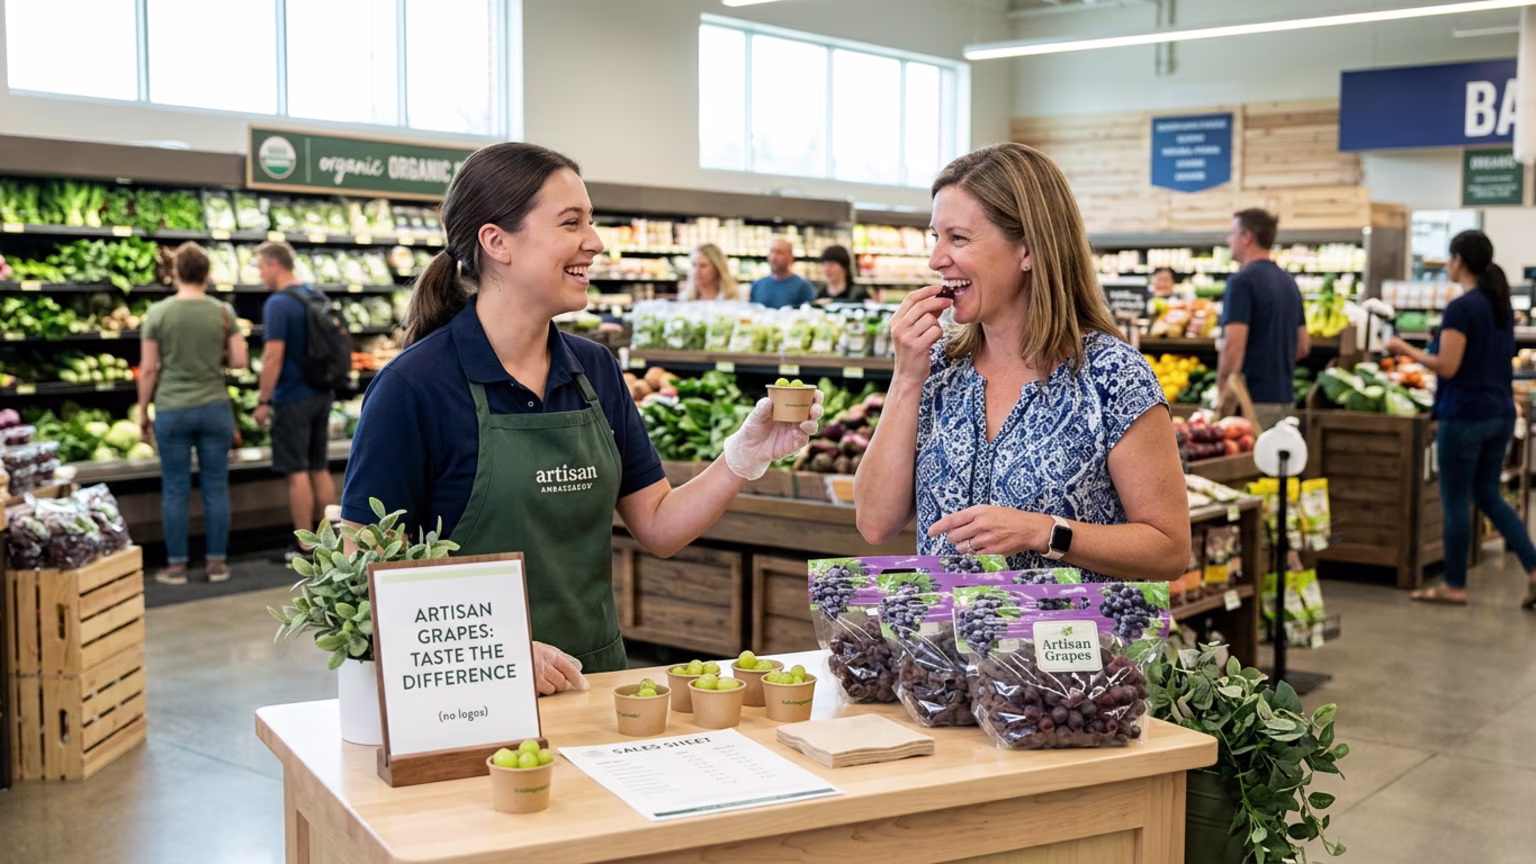
Consider a national beverage brand launching a new sparkling water across regional grocery chains. The brand team knew that raw foot traffic would not secure permanent shelf space. They needed to prove that their endcap presence drove actual retail sell-through. Their leadership demanded verified data from the field.
They deployed a cross-merchandising strategy by pairing the beverage with a popular salty snack. The field team used trackable digital coupons distributed during the retail demo. By analyzing point-of-sale data, the brand proved a twelve percent lift in basket size. They identified that dwell times peaked on Thursday afternoons rather than Saturday mornings.
This data allowed them to reallocate staffing resources to match shopper behavior perfectly. The campaign connected digital and real-world touchpoints to boost product visibility. By linking trial directly to sales lift, the marketing team won long-term confidence from the retail buyer. This is the true power of retail demonstrations that drive real sales.
Our agency applies this exact level of rigor to every project. We store your sampling product and event gear securely. We then ship, track, and coordinate delivery nationwide so every activation stays on schedule. Your field team can focus entirely on consumer engagement and data collection.
Let us return to that crowded store aisle and the twenty-five percent dwell time increase. A busy demo table is only valuable if you can prove what happened after the shopper walked away. When you combine visitor counts with verifiable point-of-sale data, the fog of war disappears. You stop hoping for a return and start reporting on guaranteed growth.

30 Years Experiential & Retail Activation Partner for CPG & Beverage Brands | Multi-Market Demos, Roadshows & Costco/Club Programs That Actually Sell

Since 1995, Makai has been connecting brands with people through live experiences, retail programs, and national activations.