Robbie Thain
Founder, CEO
Learn how to track QR scans, coupon redemptions, and shelf movement to prove ROI from pop-up activations and justify your field marketing budget.

US mobile QR code redemptions reached 5.3 billion in 2025 according to recent data from QR TIGER. Physical marketing is no longer an untrackable investment. Field marketing leaders can now link physical activations directly to pipeline revenue using exact data.
This guide outlines how to track conversion signals from pop-up activations to prove Return on Investment. You will learn how to build a simple data handoff that justifies field spend to the broader revenue team.
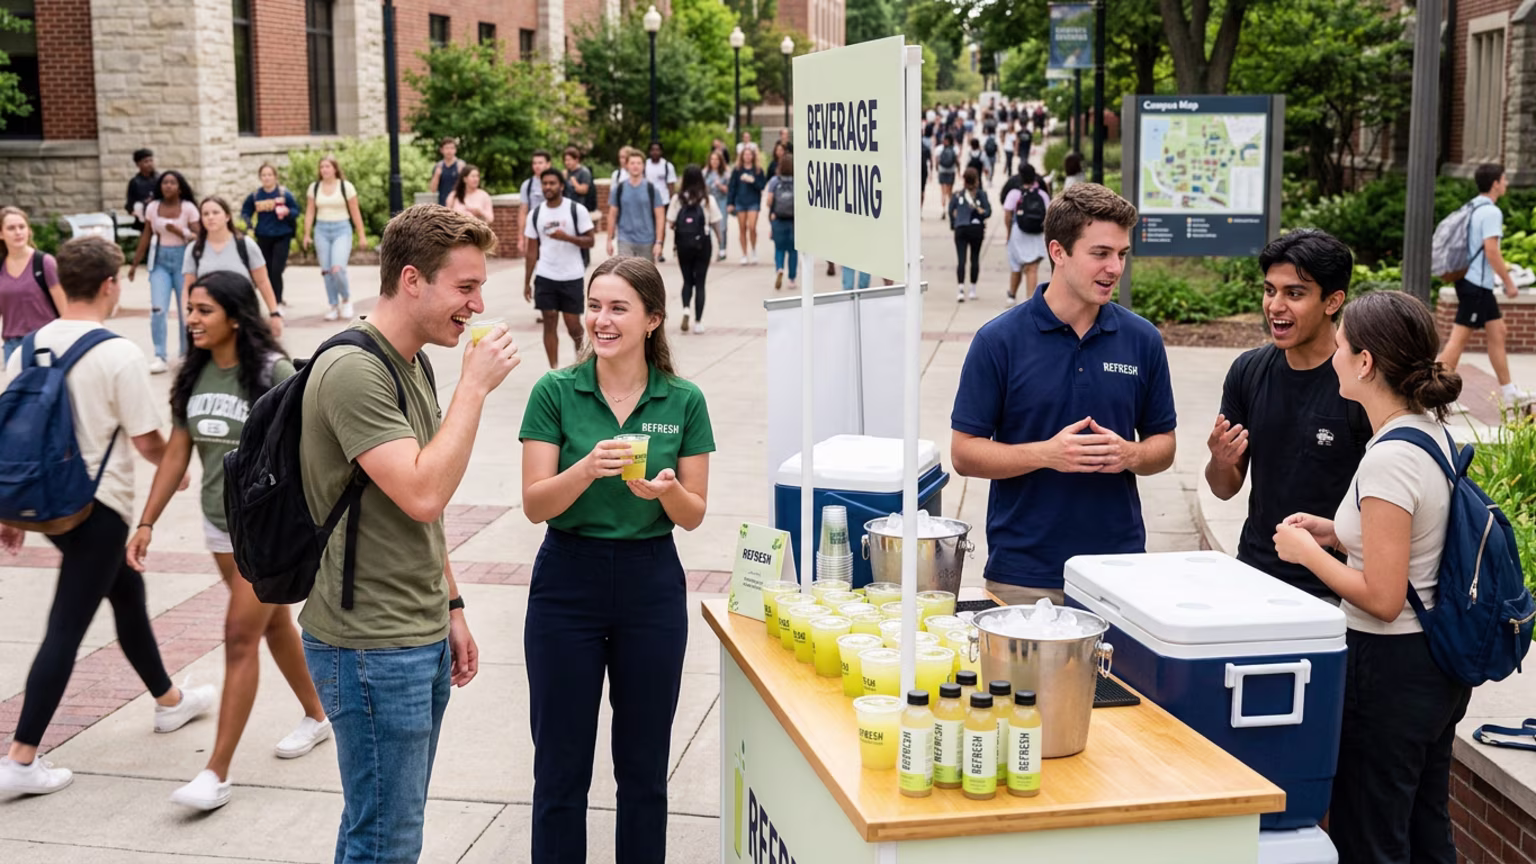
The trade show floor feels electric at first glance. Your brand ambassadors are handing out samples to a massive crowd of attendees. The booth is packed with people taking photos and grabbing free merchandise. Everyone seems happy with the brand interaction.
Then Monday morning arrives. Your leadership team asks for the Return on Investment (ROI) from the weekend. You stare at a spreadsheet with nothing but estimated foot traffic and a depleted inventory count. The finance department wants to know how many sales the event actually generated. You have no concrete answers for them.
This creates tension between your field team and the executive suite. The lack of data makes every future budget request a painful negotiation. Reporting that a demo was busy is no longer acceptable in boardrooms according to Makai Inc. Leaders must defend their field budgets with hard numbers instead of vague impressions.
Without a clear tracking mechanism, your activation looks like a sunk cost. You have no way to separate genuine leads from casual freebie seekers. The entire effort gets written off as a brand awareness exercise. It becomes impossible to build ROI frameworks for field marketing without concrete data.
Marketing leaders must transition from vanity metrics to hard conversion signals. Counting smiles and handshakes does not impress your executive team. You need a structured framework that connects every physical sample to a verifiable digital transaction. This requires bridging the gap between the activation and your digital tracking systems.
The solution lies in capturing data at the exact point of consumer interaction. A staggering 48 percent of consumers scanned a QR code for a product in the past week based on data from QR TIGER. This behavior provides the perfect bridge between offline experiences and online attribution. You just have to place the tracking mechanism in the right spot.
Experts advise shifting focus toward attributable outcomes like redemptions and sales spikes. According to The QR Code Generator, QR codes turn every storefront display into a trackable touchpoint. This allows you to measure physical performance just like your digital channels. You can finally determine which store location brings the most signups.
Print materials yield an eight to twelve percent scan-to-action conversion rate based on findings from QR TIGER. This significantly outperforms the typical one to three percent click-through rate of digital display ads. For marketers measuring cost per conversion, physical codes often beat digital channels. You just need to track them properly to prove it.
It takes discipline to maintain this level of tracking accuracy. Your field team must understand that data collection is just as important as brand enthusiasm. A beautiful pop-up means nothing if you cannot prove who showed up. The best field marketing operators treat their event footprints like high-converting landing pages.
By mapping out the data flow before the event begins, you create clear visibility. A simple data handoff to your customer relationship management system aligns both sales and marketing. This automated flow reduces friction between different departments. This approach proves the true value of experiential marketing measurement across the entire company.
Building a trackable activation requires precise operational planning. You must remove all friction from the redemption process to get accurate data. Follow this playbook to set up your tracking infrastructure. Every step is designed to capture maximum consumer intent without confusing the buyer.
First, deploy dynamic QR codes at eye level on all displays. Eye-level placement boosts scans by 47 percent over waist-height positions according to industry research. Make sure the code features a clear and benefit-led call to action. Phrases like "Scan for instant discount" work significantly better than a plain code.
Second, assign unique redemption codes to every brand ambassador and event location. This isolates your specific event impact from baseline sales noise. If you hand out generic codes, you will never know which ambassador drove the sale. Unique codes give you perfect attribution for your field spend according to Makai Inc.
Third, create an automated data handoff schedule to maintain momentum. Export your scan and redemption data weekly into a basic spreadsheet format. Tag these files with specific campaign parameters using standard UTM codes. Send this formatted data directly to the sales team to keep everyone aligned.
Fourth, sync this offline data directly into your tracking software. This gives your sales team immediate visibility on qualified leads. It allows you to compare store-specific redemptions to verify event impact. You can track exactly how well brand activations perform in different markets.
You must train your brand ambassadors on this data handoff process. They need to understand why unique redemption codes matter for their own performance reviews. When the field team buys into the tracking system, your data quality improves dramatically. Accurate data collection starts with the person handing out the sample.
Finally, run weekly reviews to optimize the campaign in real time. Dynamic QR codes offer three to five times higher engagement than static codes based on reports from QR TIGER. Compare different placements and pause the low-performing options immediately. Update digital destinations using dynamic codes to match new promotions.
Proving your impact means looking at the exact numbers that drive revenue. Field marketing leaders must monitor these five metrics closely to avoid fragmented reporting. These numbers turn pop-ups into revenue engines. They address executive pressures for measurable trial and sell-through.
This is your primary lead indicator of consumer engagement. You should aim for a ten to twenty percent scan rate for in-store displays as noted by The QR Code Generator. Keep an eye on the dashboard to track scans by location and device. This tells you exactly where the most engaged consumers are standing.
Average daily scans per code hit fifty to one hundred in high-traffic spots according to The QR Code Generator. Research from QR TIGER shows that 94 percent of smartphone users under age 45 have scanned a code. You are tapping into an established behavior rather than forcing a new one. This makes it easier to gather massive amounts of data quickly.
This metric provides undeniable proof of conversion for your campaign. Retail brands using QR codes on packaging see twenty to thirty percent higher engagement according to QR TIGER. Track register scans to link interactions directly to real revenue. This is the hardest data point you can present to leadership.
It proves that a physical interaction led to a financial transaction. It completely silences any critics of your event strategy. By watching redemption rates, you can see which promotions resonate best with your target audience. You can refine your offers based on actual buyer behavior.
Look closely at your same-week checkout velocity during and after the demo. Store manager reorder rates post-depletion prove that your activation drove actual restocks. This metric links your free trials directly to a noticeable sales lift based on analysis by Makai Inc. It is the ultimate lag indicator of success.
It completely justifies the cost of your roadshow to upper management. A spike in shelf movement proves that your brand ambassadors are creating genuine product demand. It separates a fun activation from a highly profitable one. This is exactly what retailers want to see before expanding your shelf space.
Divide your total activation cost by the total number of products sampled. Use this efficiency metric to defend your budgets in financial meetings. It shows exactly how much it costs to put a product in a consumer hand. Lowering this cost over time proves operational maturity.
It demonstrates that you run a tight ship. Tracking this efficiency helps you compare different event formats against one another. You might find that smaller mobile tours offer a much better cost per trial than massive trade show booths. This data dictates where you should spend your budget next quarter.
Divide your total meaningful conversations by the total floor traffic. This prevents the illusion of an event that looks busy but produces fog. It guarantees your brand ambassadors are actually engaging with the right people. High interaction rates indicate a highly effective field team.
Integrating these numbers helps you master field marketing vs experiential marketing strategies. It tells you if your staff is standing behind the table or actively working the crowd. You can use this metric to evaluate ambassador performance and improve future training sessions.
Putting this theory into practice changes the entire dynamic of a campaign. A VP of Marketing in the CPG beverage category told us: 'Robbie, your leadership and vision turned our campaign into something truly special. The Makai team brought our new drink to life with energy, creativity, and flawless execution. Thanks to you, our brand isn't just tasted, it's remembered.'
Our team's approach transformed their product launch into a memorable brand experience. We achieved this by tying event-specific tracking codes to immediate retail purchases. Every single sample was paired with a dynamic code that offered instant savings. When those codes were scanned at the register, we gained perfect attribution.
The campaign resulted in a verifiable spike in same-week checkout velocity. The brand could confidently show their retail partners exactly how much foot traffic they drove. This data completely transformed their conversations with store managers. It turned theatrical marketing into undeniable evidence of demand.
Store managers began reordering the product at a significantly faster rate. They saw the direct link between the activation and their own register rings. This level of retail confidence is exactly what consumer packaged goods brands need. It is especially powerful during competitive Costco roadshows or massive retail pushes.
This retail confidence translates directly into stronger future partnerships. Retailers want to work with brands that can prove their own foot traffic. They prioritize shelf space for products that guarantee a measurable sales lift. Your ability to track physical conversions makes you a highly attractive partner for any major retailer.
Those 5.3 billion mobile QR redemptions from 2025 are not just a random statistic. They represent a massive shift in how physical marketing is measured and managed. The electric energy of a packed trade show floor no longer has to end in vague estimates. You can capture that raw excitement and convert it into a measurable pipeline.
Your leadership team will finally see the exact value your pop-ups bring. By tracking these five core metrics, you build undeniable proof of your success. You will never have to rely on estimated foot traffic or smile counts again. Every sample handed out will have a clear path to a recorded sale. Data brings total clarity to your field operations.
Stop letting your physical activations exist in an untrackable void. It is time to implement a tracking system that proves your worth. Book a strategy call with our team to start building your data-driven activation plan today. We will help you turn every consumer interaction into a verified transaction. You can finally lead your next campaign with total operational confidence.

30 Years Experiential & Retail Activation Partner for CPG & Beverage Brands | Multi-Market Demos, Roadshows & Costco/Club Programs That Actually Sell

Since 1995, Makai has been connecting brands with people through live experiences, retail programs, and national activations.