Robbie Thain
Founder, CEO
Turn trade show traffic into measurable pipeline with this guide on proving Return on Investment through post event roadshows and localized retail activations.
Sarah stares at the fishbowl full of business cards at booth 402. The expo hall lights glare down on a space that saw a thousand visitors today. She has zero idea how many of those people will actually buy her new beverage line. The tension is real and the quarterly review is looming fast.
Proving a positive Return on Investment from trade shows requires tracking physical engagement into post event roadshows with precision. This guide provides the exact framework and metrics needed to turn raw booth traffic into documented sales pipeline.
Trade show floors often become a blur of scanning badges and handing out product samples. Field marketing directors spend massive budgets on prime real estate and flashy booth designs. The problem hits the moment the event ends and executive leadership asks for the revenue numbers. Most teams can only point to total foot traffic and scanned leads.
They lack the data to show how those interactions drive retailer confidence or sell through. Executives are tired of vanity metrics and demand proof that live events generate actual business growth. When you fail to measure trade show success beyond basic foot traffic, the marketing budget gets cut. The pressure to justify experiential marketing spend keeps operators awake at night.
A busy booth looks great in photos. The reality sets in when those scanned leads sit untouched in a spreadsheet for weeks. Sales teams complain about the low quality of the prospects. The marketing team struggles to attribute any actual retail velocity to the event. The disconnect between physical engagement and digital reporting creates a massive blind spot for brands.
Many companies compound the error by relying on generic email blasts after the expo ends. They treat all booth visitors the exact same way. The true value of a physical interaction gets lost in the digital noise of automated follow ups. Operators need a system that captures the momentum of the live event and carries it into the local markets where consumers actually shop.
Risk mitigation becomes the top priority for marketing leaders. They must transition their strategy from fog to evidence reporting. A busy booth filled with people grabbing free pens looks like success to an untrained eye. The trained operator knows that true success requires documented proof of pipeline velocity.
To solve this problem systematically, brands must connect the initial trade show interaction to a localized post event roadshow. Research from the Center for Exhibition Industry Research reports that seventy eight percent of exhibitors find event leads are higher quality than other channels. Connecting those leads to a targeted regional tour captures that buying intent. This approach relies on scoring the initial booth visits and routing the best prospects to physical activations in their local markets.
It shifts the measurement from isolated event data to continuous pipeline tracking. We have executed over 1000 campaigns across all 50 states, bringing brands to life in every major U.S. market. From retail demos in Seattle to roadshows in Miami and events in Honolulu, our teams activate brands wherever our clients' audiences are located. This operator grade discipline has shown us that hope is not a strategy. You need a systematic way to move leads from the expo floor to regional follow ups.
The framework starts before the trade show doors even open. Marketing leaders must define the exact criteria for a qualified lead. They must train the booth staff to gather actionable intelligence during every conversation. The goal shifts from collecting the most business cards to identifying the best regional prospects.
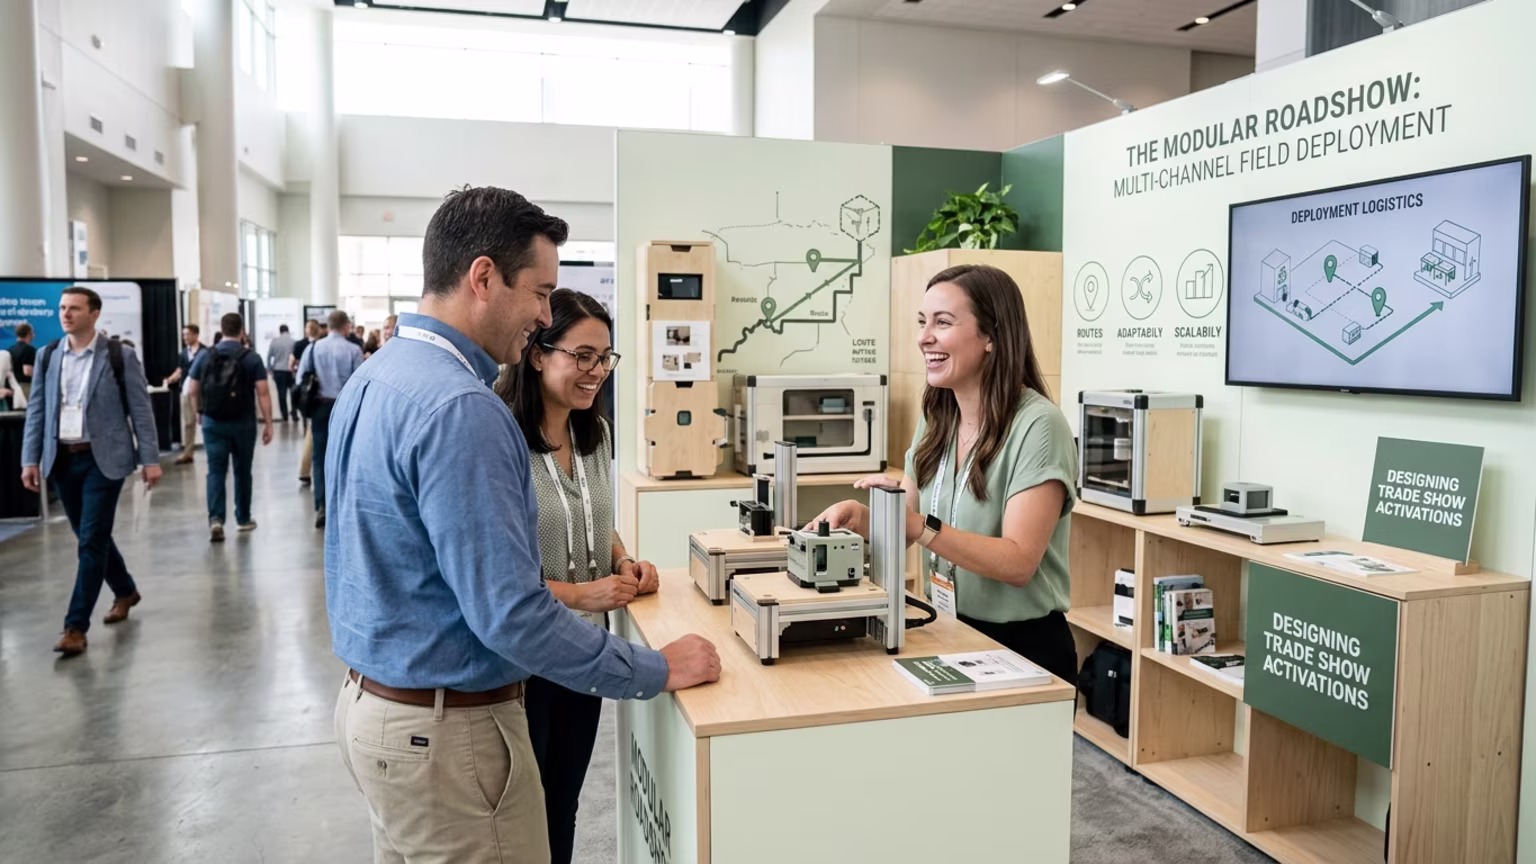
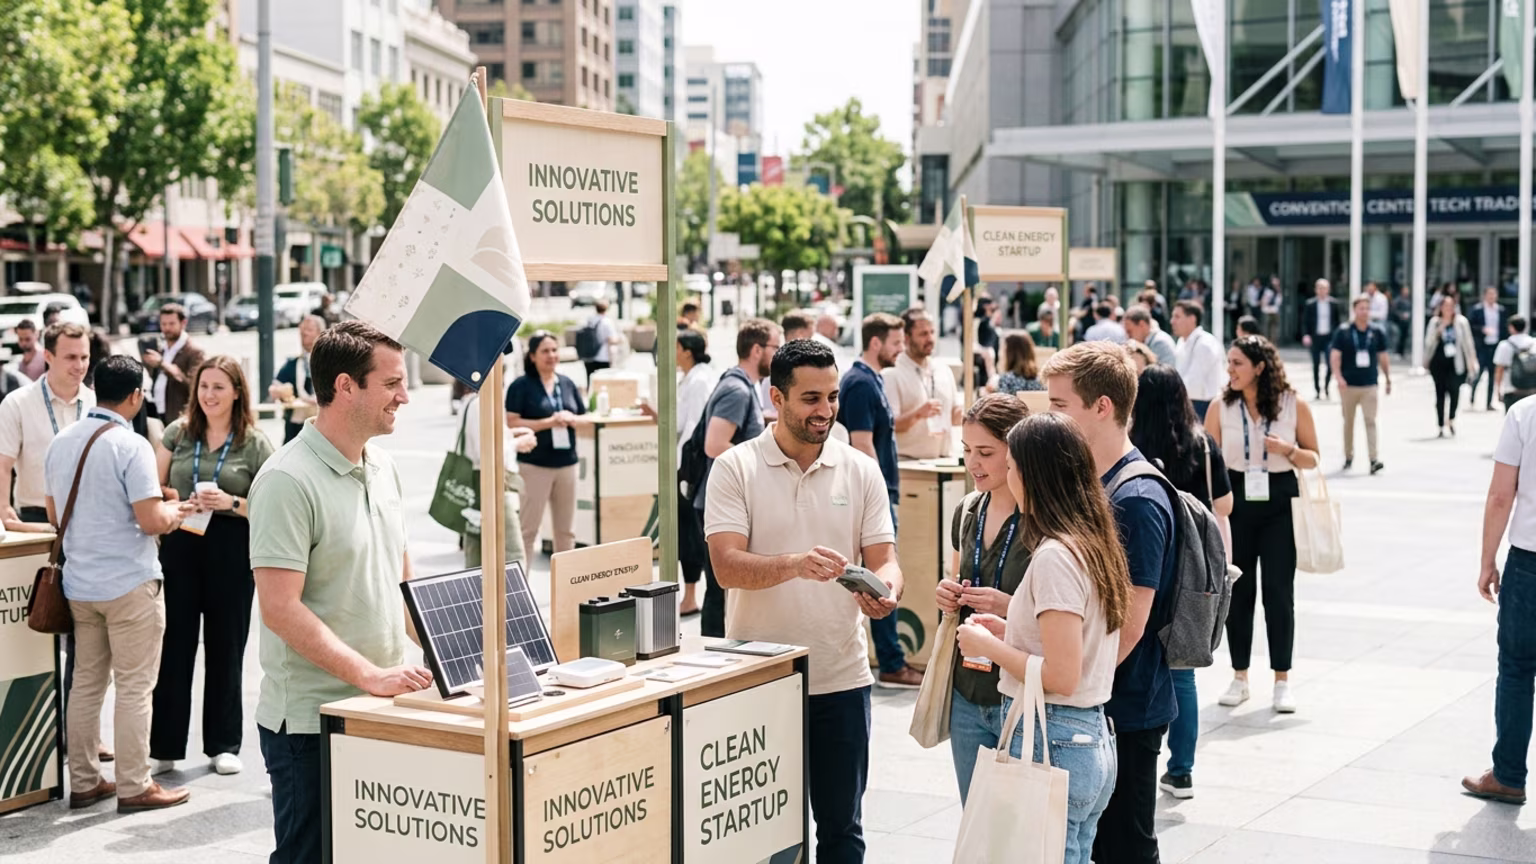
Once the target markets are identified, the brand deploys a series of mobile experiences. These local stops serve as the critical bridge between brand awareness and consumer trial. The strategy eliminates the guesswork from event marketing. It provides a clear path to revenue that stakeholders can actually measure.
Industry veterans note that the financial return is not about taking booth selfies. The true value lies in proving pipeline velocity. Brands that qualify their raw traffic through regional follow ups routinely deliver exceptional returns. Some campaigns achieve a four hundred percent Return on Investment by qualifying seventy percent of their raw event traffic.
They present dashboards showing a cost per lead under two hundred dollars. This cost stands in sharp contrast to digital campaigns that often exceed five hundred dollars per lead. This financial clarity wins stakeholder approval every single time. Modern platforms use artificial intelligence to run real time sentiment analysis on booth interactions.
Facial recognition tools measure dwell time to boost lead scoring accuracy by thirty five percent. This technology enables predictive modeling for your regional tours. You no longer have to guess which city will produce the best sales lift. The data tells you exactly where to deploy your field teams for maximum impact.
The approach demands strict compliance with new data privacy regulations. Updates to privacy laws mandate explicit opt in for post event tracking. Brands that ignore these rules risk losing a massive percentage of their collected leads. Smart operators use compliant funnels to move prospects safely into their marketing database.
A structured approach turns fleeting expo interactions into regional sales momentum. Use this step by step guide to implement the strategy in a live event setting.
You need clear lead and lag indicators to report accurate returns to your stakeholders. These specific metrics turn experiential investments into undeniable pipeline evidence.
Raw foot traffic means nothing without context. Track visits per square foot using footfall sensors to gauge real engagement. Top performers average fifty to one hundred interactions per staffer daily. This data correlates directly to a fifteen percent conversion rate to qualified leads when tracked properly. The engagement score helps you predict the potential volume for your follow up activations.
Track leads from scan to close using BANT criteria for budget, authority, need, and timeline. Data from HubSpot suggests these scored leads yield three times higher pipeline value. Analysts report that sixty five percent of trade show leads close within six months. This velocity proves that physical interactions beat digital channels for speed to revenue.
Measure the local sell through impact ninety days after the roadshow concludes. The Field Marketing Council reports a twelve to eighteen percent uplift in retail sell through for CPG brands post activation. Tracking this metric requires integrating your CRM data with standard retail measurement tools. It provides the ultimate proof that your experiential event strategy moves actual products off physical shelves. Stakeholders absolutely need this critical lag indicator to justify future marketing budgets.
Post event surveys reveal forty percent of leads convert to sales when nurtured through automated sequences. You can improve this number by deploying tracking the financial return on mobile tours effectively. The handoff from the expo floor to the regional event must be seamless. A high conversion rate shows your targeting strategy is working. It validates the decision to invest in physical activations over purely digital campaigns.
Use a standard formula dividing your net revenue by your total event costs. The industry average Return on Investment sits at three hundred sixty five percent with follow up roadshows. Industry analysts report this number drops drastically to one hundred fifty percent without any regional follow up. You must track every single dollar spent against the actual pipeline generated to secure future budgets. A clear dashboard showing this financial metric is your best defense against arbitrary budget cuts.
Modern brands now track their carbon footprint per lead generated. Benchmark reports show brands aiming for less than five kilograms of carbon dioxide per interaction. Green roadshows correlate to a fifteen percent premium on close rates from eco conscious buyers. This new layer of reporting appeals strongly to health and wellness audiences. It shows that your brand cares about the community as much as the bottom line.
Multi touch attribution models often show live events contributing only fifteen percent direct credit. This dilution happens when retail and digital channels overlap the reporting. Marketing leaders counter this by running incrementality tests to isolate the event impact. These tests often prove a twenty five percent uplift when the experiential channel is measured properly. Clear attribution prevents your best campaigns from looking like a waste of resources.
Imagine a premium snack brand launching a new product line at a national trade show. They captured high intent leads and immediately routed them into a three city Costco roadshow pilot. The regional tours focused exclusively on markets where key retail buyers were located. The brand staffed the local events with trained ambassadors who understood the core messaging.
By tracking UTM links from the initial trade show scan to the local roadshow trial, they built undeniable evidence of demand. The brand reported a twenty eight percent trial to purchase rate. This concrete data secured a massive nationwide retail rollout for the upcoming quarter. The activation proved that a systematic approach turns event chaos into measured pipeline.
The brand initially struggled with delayed measurement. Sales lift often appears ninety to one hundred eighty days post roadshow. This delay frustrates quarterly focused executives. The team solved this by using leading indicators like engagement scores to predict the future revenue. They showed that strong early engagement predicted eighty percent of the variance in eventual sales lift.
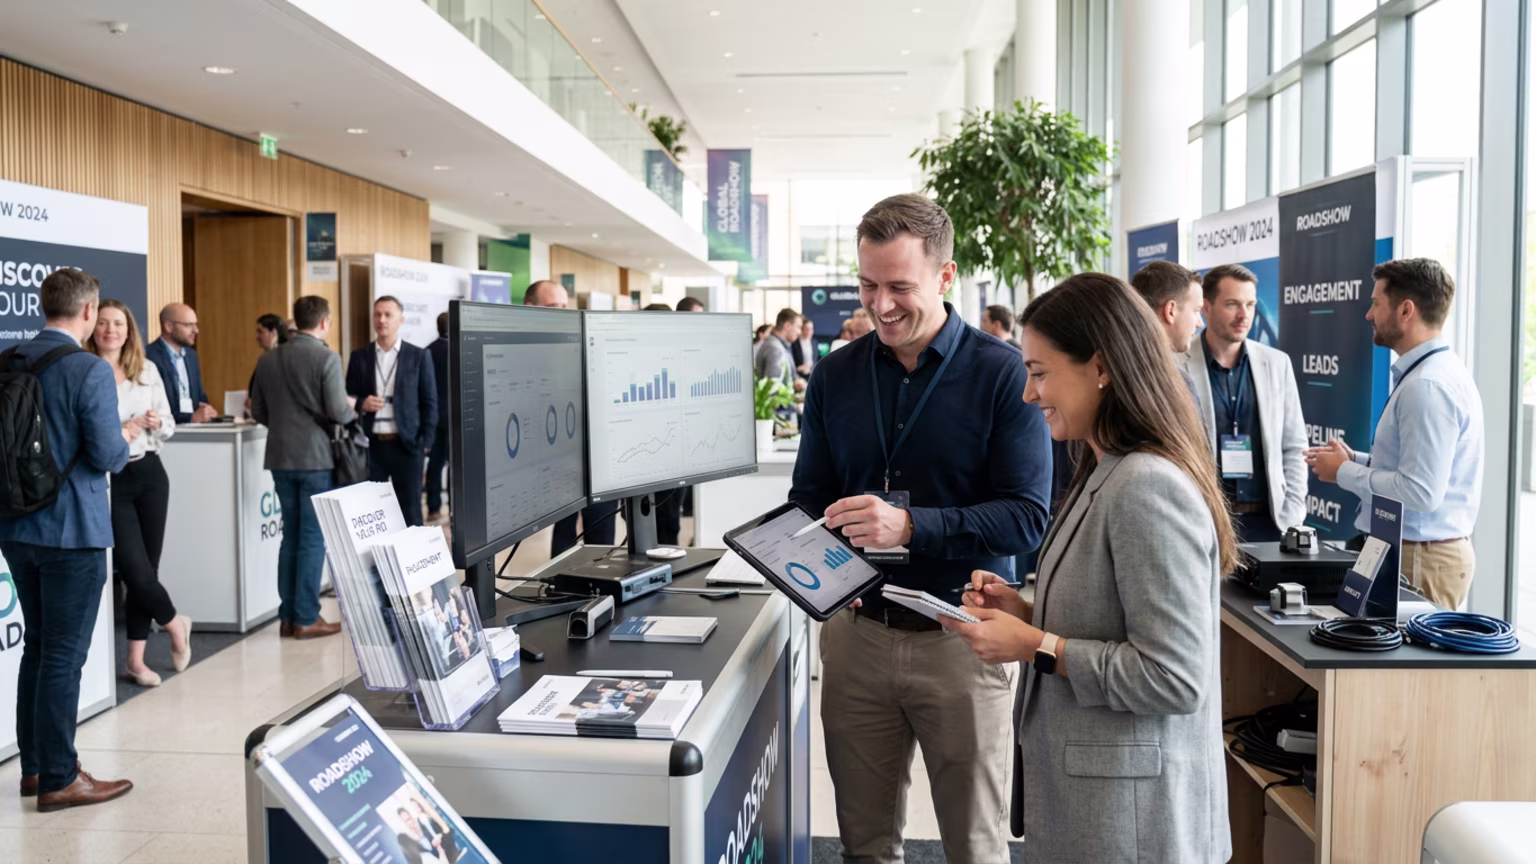
The marketing team presented a simple one page report to the executive board. It showed one thousand two hundred initial booth visits. Those visits translated into three hundred qualified leads. The local roadshows converted sixty five of those leads into confirmed sales. The clear narrative secured their budget for the entire next year.
The brand integrated TikTok content into their regional roadshows to capture younger demographics. They scanned trade leads into shoppable video streams. This integration produced a thirty one percent jump in financial returns compared to their previous offline campaigns. The modern approach proved that merging digital tracking with physical trial creates massive retail momentum.
Segment your scanned badge data today to identify which local market needs a physical activation next.
Book a strategy call with our team to start planning your next revenue generating campaign.

30 Years Experiential & Retail Activation Partner for CPG & Beverage Brands | Multi-Market Demos, Roadshows & Costco/Club Programs That Actually Sell

Since 1995, Makai has been connecting brands with people through live experiences, retail programs, and national activations.