Robbie Thain
Founder, CEO

Seven operational layers, structured queue topologies, and capacity formulas help exhibition teams manage peak floor traffic and capture qualified leads.
How to manage trade show booth crowds without losing qualified leads is a question every field marketer searches for after a chaotic expo. This manual provides the definitive operational blueprint for designing booth capacity, structuring queues, managing sampling lines, and protecting sales pipeline under peak floor traffic.
Operational crowd management transforms trade show floor congestion from a chaotic liability into a structured system that protects visitor safety and maximizes commercial throughput. By applying rigorous capacity planning, role specialization, and spatial zoning, brands convert high-volume foot traffic into verified, sales-ready pipeline.
The trade show floor at 10:30 AM is often pure friction. A major keynote concludes, releasing thousands of attendees into the main exhibit hall simultaneously. Within ninety seconds, a wall of people hits the exhibit perimeter, clogging the main aisle and spilling past boundary lines. Walk-up visitors looking for a quick five-second scan collide with pre-booked enterprise prospects arriving for scheduled briefings. Staff members scramble to distribute product samples, answer technical questions, and scan badges on dying mobile devices. In this environment, high-value prospects walk away in frustration while casual passersby consume all available staff time.
Crowd management is fundamentally a discipline of service design and capacity planning. The physical choices that keep aisles clear also dictate whether staff can conduct meaningful discovery and gather accurate data. A trade show exhibit operates as a high-density, multi-stage service environment. It must simultaneously accommodate fast-moving foot traffic, focused product trials, and private commercial conversations without cross-stream contamination.
According to guidance from the Health and Safety Executive, crowd management requires structured controls across three distinct phases: arrival, onsite circulation, and dispersal. When applied to an exhibition exhibit, this framework demands that arrival rates never exceed the combined processing capacity of the booth. Systemic crowd failure occurs when these stages merge into an undifferentiated mass of bodies.
Modern crowd management follows seven operational layers that govern booth performance:
Demand modeling forecasts the exact timing and volume of visitor arrivals throughout the show day. Foot traffic is never linear. Surges occur immediately after floor opening, following major conference track breaks, during scheduled product unveilings, and across peak afternoon periods. Operational planning must account for competitor presentation schedules and nearby anchor attractions. Anticipating crowd density allows the booth manager to deploy reserve staff before bottlenecks form.
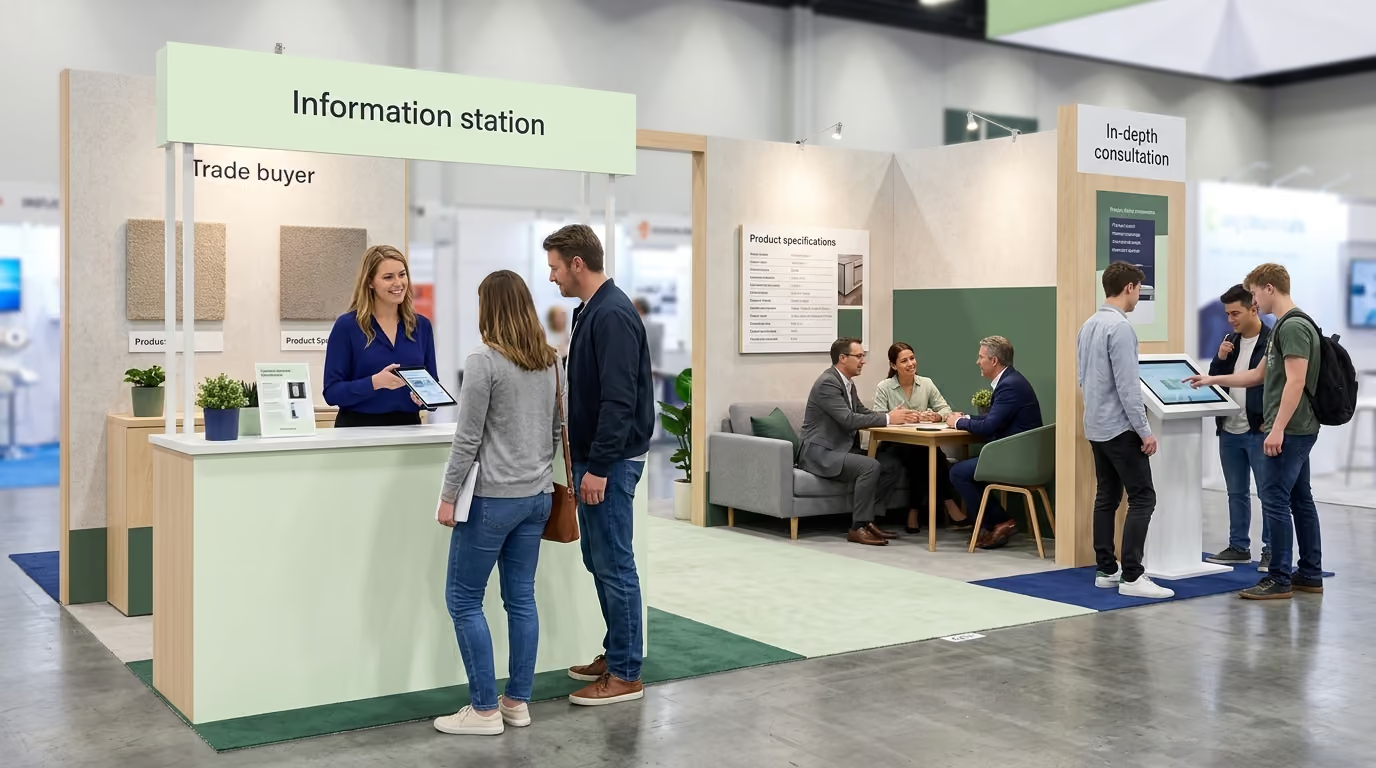
Spatial zoning establishes defined physical territories for distinct visitor behaviors within the booth footprint. Every square foot must serve a dedicated operational purpose. The layout must separate high-speed peripheral browsing from deep-dive technical consultations. Clear lanes must accommodate entry, engagement, exit, accessible transit, and back-of-house supply restocking. Health and Safety Executive standards highlight the necessity of keeping all emergency egress routes and safety assets completely unobstructed by public queues.
Service pathways define the exact steps a visitor takes based on their specific intent. A self-guided attendee browsing print collateral requires a different operational path than an enterprise buyer evaluating enterprise software. Mixing these interactions creates immediate friction and slows total booth throughput. Mapping distinct service pathways prevents low-intent visitors from consuming resources allocated to high-value discovery.
Role allocation assigns staff to functional operational posts rather than generic booth duty. Staff members should never attempt to greet arrivals, qualify prospects, deliver technical demonstrations, and manage inventory simultaneously. Assigning dedicated responsibilities ensures that crowd control functions operate without compromising sales conversations. Clear operational roles allow the team to maintain spatial boundaries during peak traffic surges.
Information design provides immediate answers to visitor questions before those visitors enter the booth perimeter. Legible signage must communicate what the product is, how long an activation takes, where specific lines lead, and how to schedule private meetings. Clear communication reduces orientation time and prevents confused crowds from blocking circulation paths. When attendees know what to expect, perceived waiting times drop significantly.
Operational triggers are pre-determined capacity thresholds that mandate immediate staff action. When a queue reaches a specific length or wait times cross an agreed limit, the floor manager executes a pre-planned adjustment. These interventions include opening secondary demonstration stations, converting walk-up queues to digital appointments, or pausing sampling handoffs. Structured operational triggers eliminate guesswork during chaotic floor surges.
Continuous learning requires logging operational bottlenecks throughout each exhibition day. Booth managers must track when queues spilled into shared aisles, which demonstration formats exceeded their allotted time, and where data capture failed. Reviewing these patterns during evening debriefs allows the team to adjust spatial layouts and staffing matrices for subsequent show days. Systematic adjustments turn single-event lessons into institutional playbooks.
Selecting the correct queue topology is the most effective operational lever for controlling floor density. Different marketing activations require different queue geometries. Forcing an interactive technical trial into a standard retail line creates immediate congestion and visitor frustration. Designing for effective flow requires aligning queue structures with interaction durations.
A single-line system feeding multiple identical demonstration stations provides the highest degree of perceived fairness. Visitors advance sequentially to the next available staff member, eliminating the anxiety of picking a slow lane. This layout requires an unambiguous entrance marker, high-contrast directional signage, and a clear exit corridor that prevents departing visitors from cutting across incoming traffic. Single lines excel for standard five-minute product overviews where interaction times remain consistent across all attendees.
Multiple specialist lines work best when an activation offers fundamentally different engagement tracks. An exhibit might feature separate lanes for general product sampling, live software demonstrations, and pre-booked executive meetings. The primary operational risk of multiple lines is visitor confusion and misdirected traffic. Every specialist lane must display bold signage stating its purpose, eligibility criteria, and estimated time commitment.
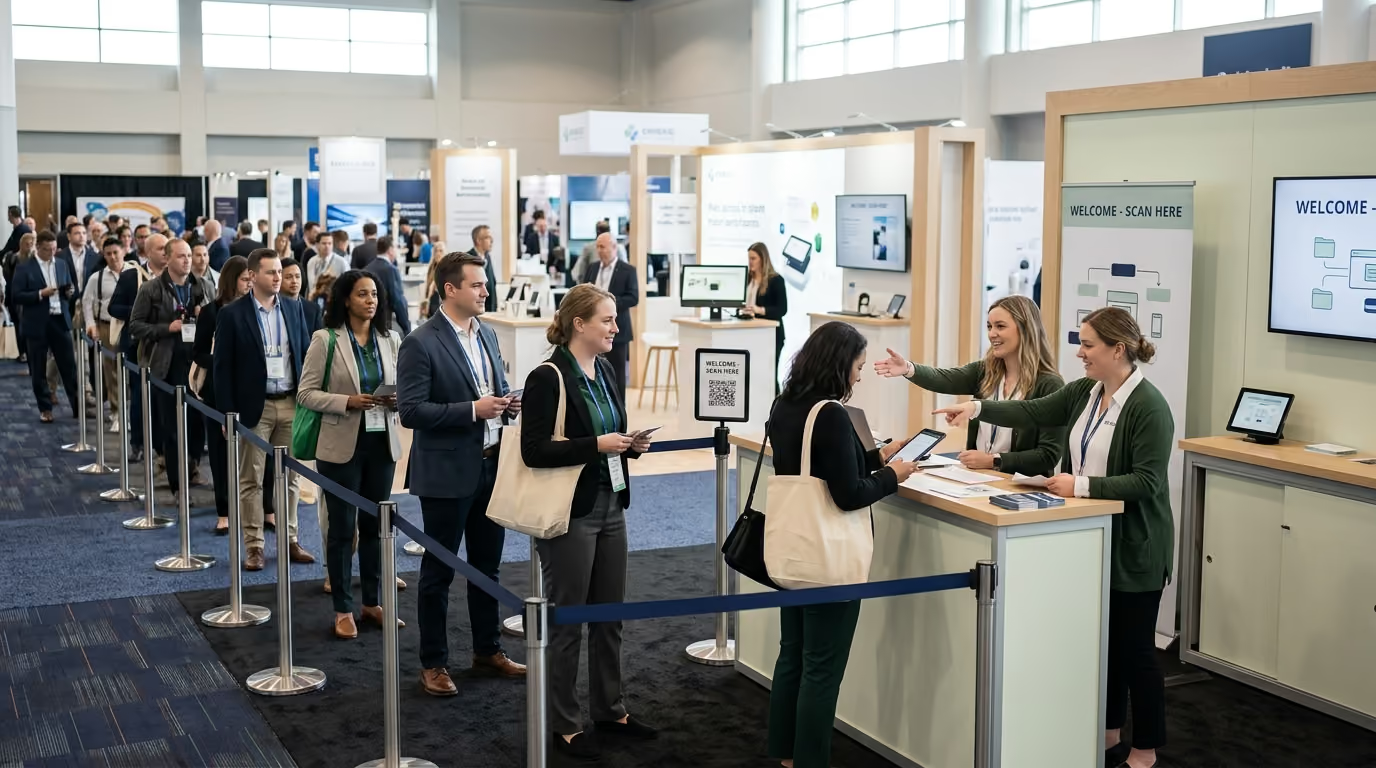
Virtual queuing systems replace physical lines with digital reservations managed via QR codes, short message service notifications, or custom event applications. Research on service systems demonstrates that perceived wait times often feel significantly longer than actual elapsed time. Virtual queues remove the physical burden of waiting, allowing attendees to explore other hall areas until their time slot opens. However, virtual queues introduce show-up variance, notification delivery delays, and identity verification challenges that demand dedicated check-in hosts.
Flow-through continuous experiences eliminate stationary lines entirely by moving visitors along a guided, one-way corridor. This topology is the industry standard for high-volume consumer sampling and sensory marketing activations. Visitors enter at one corner, receive a brief brand overview, collect their sample, and exit through the opposite corner. Integrating sensory design in trade show spaces into a flow-through layout keeps attendees engaged without stalling physical momentum.
Physical queue geometry must comply with rigorous accessibility and venue safety standards. VisitBritain accessibility guidelines specify that clear queue widths must measure at least 1,200 millimeters for straight sections and expand to 1,500 millimeters wherever the line changes direction. Western Australia event safety standards recommend an optimal lane width of 2.5 meters in each direction for dual-stream circulation corridors. Stanchions and floor graphics must never narrow shared venue aisles or infringe upon neighboring exhibit footprints.
Calculating true booth capacity requires analyzing interaction speeds and physical space constraints. A common planning mistake is equating the physical square footage of an exhibit with its service capacity. Physical capacity defines how many bodies can stand within the footprint without violating building codes. Service capacity measures how many meaningful, high-quality interactions your team and equipment can successfully deliver per hour.
Operational planning requires balancing five distinct capacity dimensions:
Physical capacity represents the gross safe occupancy of the clear floor area, excluding built structures, counters, and private conference rooms. This metric sets the absolute ceiling for human occupancy under local municipal fire regulations. Exceeding physical capacity triggers immediate safety interventions from venue marshals.
Service capacity represents the maximum throughput of your demonstration equipment, sample stations, and staff interactions. If a booth features four interactive demonstration stations running eight-minute cycles, the maximum technical throughput is thirty completed demonstrations per hour. Adding more staff without adding presentation hardware will not increase service capacity.
Attention capacity defines the maximum number of simultaneous, high-depth discovery conversations your staff can conduct without degrading note quality or qualification rigor. When crowd noise and density exceed comfortable limits, staff attention fractures. This leads to rushed conversations, missing qualification data, and lower pipeline conversion.
Inventory capacity dictates the volume of physical product, promotional collateral, disposable sampling vessels, and premium giveaways that can be safely staged onsite. Running out of active inventory stalls service lines, while overstocking backrooms creates fire hazards and blocks staff transit corridors.
Data capacity measures the speed and reliability with which staff can capture, verify, and enrich badge information during severe traffic spikes. If your digital capture system requires forty seconds per badge scan, a single device cannot process more than ninety visitors per hour. Lead capture hardware and network bandwidth must match peak arrival velocity.
To maintain operational stability, booth leadership must establish clear color-coded trigger thresholds:
A successful crowd management strategy relies on specialized staffing rather than generic booth coverage. Assigning unspecialized staff to a crowded booth creates operational chaos. High-performing exhibits operate like well-drilled flight decks, where every team member executes a specific operational assignment.
In our experience across more than 1,000 campaigns in all 50 states, from retail demonstrations in Seattle to roadshows in Miami and events in Honolulu, we have seen that crowd congestion is rarely a sign of success. Rather, unmanaged crowding is often an operational failure that destroys conversation quality and burns out booth teams. When team members understand their exact functional roles, foot traffic flows smoothly and lead capture accuracy remains high even during massive conference surges.
Operational staffing models divide the floor team into four distinct operational tiers:
The Greeter stands at the primary approach zone to direct traffic and manage peripheral flow. This person does not deliver long product pitches or capture detailed qualification data. Their sole mission is greeting visitors, answering orientation questions within fifteen seconds, and directing people toward the correct service lane. The Greeter prevents incoming crowds from forming unorganized clusters at the booth boundary.
The Queue Host manages the physical line, maintains spatial boundaries, and sets accurate wait expectations. This individual actively engages waiting attendees, distributes introductory literature, explains demonstration requirements, and pre-qualifies visitors while they stand in line. When wait times climb, the Queue Host transitions qualified enterprise prospects out of the physical line and into digital appointment slots.
Product Demonstrators focus exclusively on presenting structured product narratives and managing interactive trials. They adhere strictly to predefined presentation timers to prevent cycle delays. Lead Qualifiers partner directly with Demonstrators to capture attendee feedback, assess commercial timelines, and document specific pain points immediately following the presentation.
Technical Specialists and Account Executives remain protected inside semi-private meeting zones or quiet conference areas. They do not manage lines, hand out marketing collateral, or reset hardware. Their working hours are reserved for high-depth commercial negotiations and technical evaluations. Using specialists to manage routine crowd flow wastefully consumes valuable sales resources.
The Appointment Coordinator oversees the check-in desk, confirms attendee credentials, monitors meeting room schedules, and manages specialist handoffs. The Logistics Runner monitors inventory levels, replenishes demonstration stock, removes packaging waste, and ensures lead capture devices remain charged. Directing the entire team is the Floor Operations Manager, who monitors real-time traffic density, tracks service times, and triggers operational adjustments.
Staff fatigue degrades crowd safety and data accuracy. When team members become exhausted, they skip discovery questions, mismanage line boundaries, and lose patience with attendees. The Floor Operations Manager must enforce rotating rest schedules during low-traffic windows. Scheduled rest periods ensure staff maintain energy and professional precision during demanding afternoon traffic surges.
High-friction activities like interactive software demonstrations, mechanical equipment trials, and food sampling generate substantial crowd interest. These activations often create a halo queue, where passive onlookers gather around an active demonstration, blocking circulation corridors without intending to participate. Managing these high-friction elements requires strict operational safeguards.
Live demonstrations should follow a standardized seven-minute execution structure designed to maintain rapid turnover while delivering core commercial value:
CPG and food sampling operations introduce complex hygiene, temperature control, and waste management requirements. Sampling trays placed directly along the aisle perimeter cause visitors to halt abruptly in circulation paths, creating dangerous bottlenecks. Sampling handoffs must occur at least six feet inside the booth perimeter to pull traffic off the main concourse.
A high-volume sampling operation must establish a continuous, unidirectional production line. The approach zone features visual allergen disclosures and product information. The handoff counter delivers the product sample in single-serve compostable packaging. Immediately downstream from the handoff, the booth must provide large, clearly marked waste receptacles to capture discarded packaging before visitors leave the footprint.
Interactive technology, including virtual reality headsets, touchscreens, and connected hardware, requires dedicated operational maintenance protocols. Booth teams must plan for device resets, battery replacements, surface sanitation, and network connectivity drops. Every digital interactive station must feature a non-digital fallback presentation that staff can execute seamlessly if hardware fails. Structuring demo-centric booth layouts ensures that technology glitches never stall physical crowd movement.
Balancing scheduled executive meetings with spontaneous walk-up traffic is a difficult operational challenge. Trade show value often hinges on high-level enterprise meetings. However, filling an entire booth schedule with pre-set appointments makes the exhibit appear closed to spontaneous enterprise buyers exploring the floor.
A balanced operational model divides booth meeting assets into designated capacity pools:
Managing pre-scheduled appointments requires strict check-in protocols. When an executive attendee arrives, the Appointment Coordinator verifies their identity, notes any accompanying colleagues, and confirms the assigned specialist is ready. If a scheduled meeting runs long, the coordinator intervenes at the twenty-five-minute mark of a thirty-minute block to prompt wrapping up. Structuring booth design for retail buyer meetings and trials provides quiet, dedicated spaces that protect executive discussions from floor noise.
Handling late arrivals requires clear rules to prevent cascading schedule delays. If a pre-booked attendee arrives more than ten minutes late for a thirty-minute meeting, the coordinator applies the standard grace protocol:
Walk-up visitors requesting immediate specialist consultations must pass through a strict qualification filter before accessing private meeting spaces. The Queue Host or Qualifier verifies company size, buying timeline, active budget, and technical fit. Unqualified attendees receive standard product overviews or digital collateral links, preserving specialist time for verified commercial opportunities.
Under intense crowd pressure, booth teams often default to two counterproductive extremes. Some teams focus entirely on conversation depth, allowing massive lines to form while dozens of qualified prospects walk away unserved. Other teams switch to speed, scanning every passing badge indiscriminately without recording context or qualification data.
According to the Center for Exhibition Industry Research, an exhibition lead represents an interaction with a verified trade visitor where follow-up is required and delivers measurable commercial value. A badge scan without contextual discovery, documented timelines, or an agreed next step is merely an expensive contact record.
To maintain qualification integrity during floor surges, staff must categorize visitors across four operational intent tiers:
Applying modern methodologies for qualifying trade show leads ensures your team captures meaningful context rather than vanity scan metrics. If lead retrieval hardware loses connectivity, staff must immediately switch to structured offline capture forms to prevent data loss.
Operating an exhibit during peak exhibition hours requires real-time monitoring of crowd density, service times, and spatial safety. The Floor Operations Manager must maintain an operational log, tracking key metrics every thirty minutes to identify emerging bottlenecks before they disrupt operations.
The central monitoring log tracks five key operational categories:
When operational anomalies occur, the team executes structured response plays:
A leading functional snack brand exhibited at a national natural products expo, anticipating intense sampling demand for a new product line. Previous appearances resulted in crowded aisles, product stockouts within two hours, and negligible retail buyer discovery.
For this activation, the brand implemented a unidirectional, flow-through sampling corridor separated from a private retail buyer lounge. The sampling corridor utilized bold floor graphics and overhead signage, guiding attendees through eligibility verification, product handoff, and immediate compostable disposal. A dedicated Greeter directed general attendees through the sampling path, while a Qualifier engaged retail buyers, routing them to a private meeting room.
The activation maintained an average sample handoff speed of eighteen seconds per visitor with zero queue spillovers into the shared concourse. The brand distributed over 12,000 samples across three show days while securing sixty-four verified meetings with supermarket category managers. Clean separation of consumer sampling from buyer negotiations produced a 40 percent increase in qualified retail distribution leads compared to the prior year.
An industrial automation manufacturer exhibited a complex robotic sorting system at a premier manufacturing conference. During previous exhibitions, the live demonstration created massive halo crowds that blocked surrounding exhibits and prevented account executives from holding scheduled partner meetings.
The team restructured the 30-by-30-foot space into three distinct operational zones: an elevated perimeter viewing area, an enclosed six-seat demonstration theater, and two private consultation suites. The public demonstration ran on a fixed twenty-minute cycle with a live countdown clock displayed on the outer perimeter. Casual observers watched the overview from outside the main circulation path, while qualified engineering teams were admitted into the interior theater for deep-dive technical evaluations.
The structured schedule eliminated unmanaged crowd clustering and kept shared aisles completely clear throughout the four-day event. Account executives conducted eighty-two pre-scheduled partner meetings without disruption, capturing detailed technical criteria for every participant. Tracking data-driven event metrics revealed that the structured theater format delivered a 28 percent improvement in post-show discovery call conversions.
Measuring the success of trade show crowd and queue operations requires evaluating both real-time operational efficiency and long-term commercial pipeline impact. Tracking operational metrics alongside revenue outcomes proves the true Return on Investment of event marketing investments.
Evaluating event performance requires balancing lead and lag indicators across the activation life cycle:
Operational excellence on the exhibit floor directly protects post-show conversion rates. When staff capture comprehensive technical criteria rather than rushed badge scans, post-show sales teams can deliver personalized, context-aware follow-up. Eliminating floor chaos ensures that every dollar invested in trade show real estate translates into measurable commercial growth.
Apply this operational checklist to evaluate your upcoming trade show activation:

30 Years Experiential & Retail Activation Partner for CPG & Beverage Brands | Multi-Market Demos, Roadshows & Costco/Club Programs That Actually Sell