Robbie Thain
Founder, CEO
Equip your marketing team with precise lag metrics to prove roadshow success. Track lead conversion, sales lift, and dealer confidence to justify budgets.

Trade show booth scans are the empty calories of event marketing. They feel great in the moment but provide zero lasting nourishment for your sales pipeline. This guide equips marketing operators with the precise lag metrics required to prove roadshow value long after the event ends. By shifting focus from booth traffic to hard data like dealer confidence and sales lift, teams can transform fleeting activations into measurable pipeline assets.
The expo hall lights finally shut off. Your field team is exhausted from three days of constant smiling. You have a massive spreadsheet of badge scans and a lingering sense of doubt. The CFO will ask for the Return on Investment on Monday morning.
You know the activation felt successful. People loved the product samples. The booth was crowded. The problem is that a crowded booth does not pay for the next quarter of marketing budget.
Without a clear system to track leads into the real world, that stack of raw contacts quickly turns into a pile of missed opportunities. Marketers face intense pressure to prove that physical activations lead to actual retail sell through. The fear of fragmented execution and poor reporting keeps brand directors up at night.
Operators need a rigorous approach to connect these live consumer interactions to hard business results. Without concrete numbers, your event remains just another expensive line item. Relying on good vibes is a guaranteed way to see your funding slashed next year.
Relying on foot traffic to justify field marketing is a losing strategy. The most effective brands treat trade shows as the starting line for a larger data operation. They build an analytical structure that connects a physical handshake to a final purchase. Brands often lose millions by failing to track the consumer journey from the expo floor to the retail shelf.
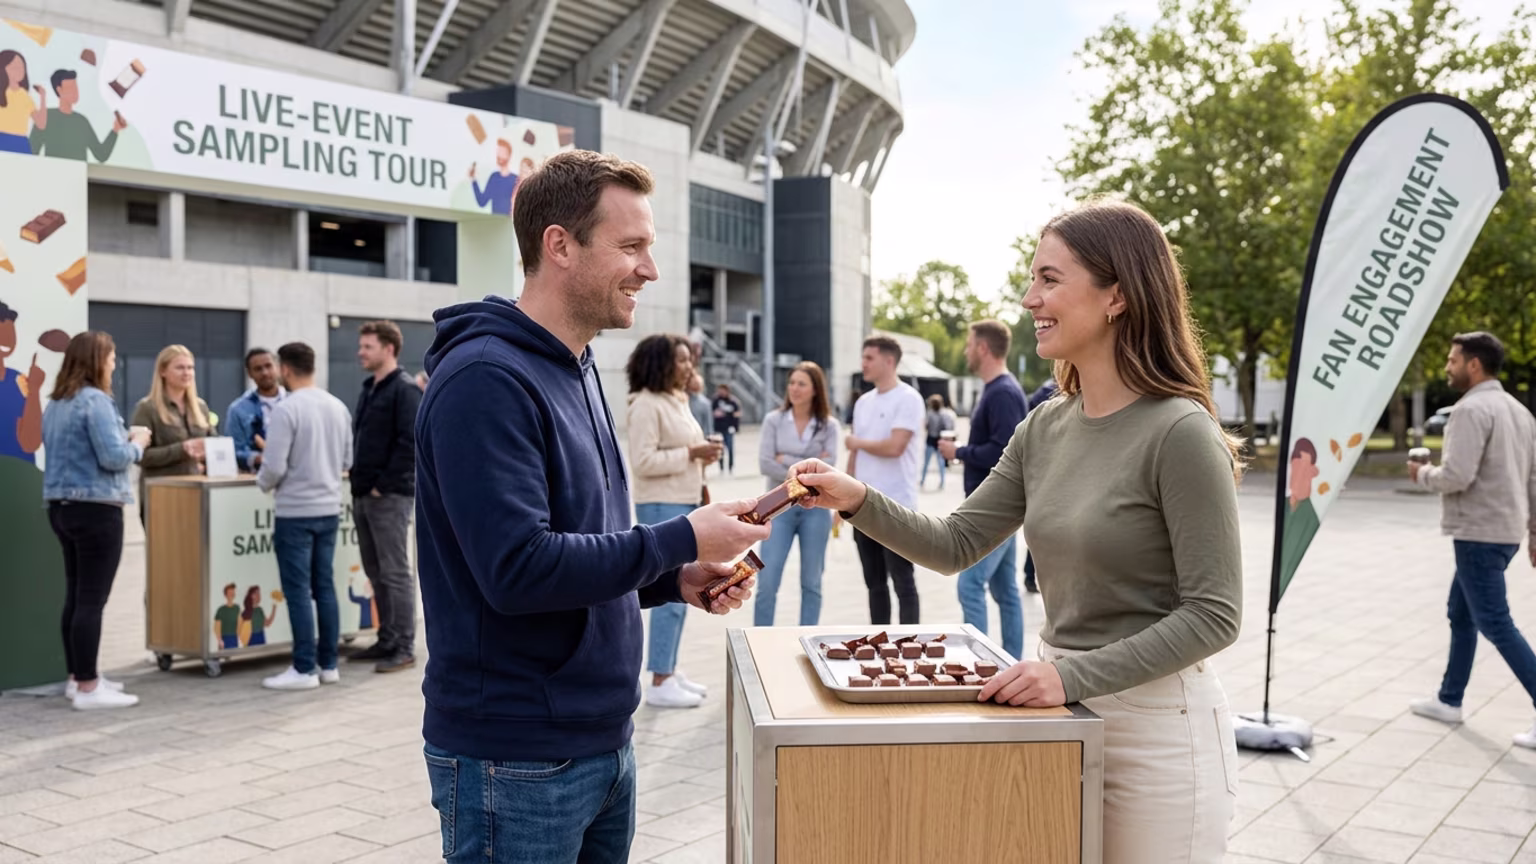
We specialize in creating retail demos, product sampling programs, and roadshows that bring brands face to face with their audiences. Each program is designed to drive trial, build consumer relationships, and accelerate retail velocity across multiple locations. To prove this velocity works, you need an operational framework.
You must shift your focus toward lag metrics immediately. Lag metrics track the lasting impact of an activation over a ninety day window. By integrating point of sale data with your customer database, you build an undeniable case for your budget. This strategy makes turning trade show booths into revenue generating roadshow hubs a standard operating procedure.
Nearly half of modern brands now use artificial intelligence tools to blend physical booth data with point of sale systems. This integration boosts tracking accuracy and delivers real time insights straight to your dashboard. The rise of hybrid events helps capture persistent digital analytics alongside physical interactions. This dual approach provides a continuous stream of data to monitor long term consumer sentiment.
Implementation requires strict discipline before the event even begins. You need a rigorous protocol for capturing and routing data. Here is the operational playbook for securing precise numbers in the field.
Brands that master this process can easily scale roadshows for retail expansion. Your field staff must be trained to scan contacts efficiently and capture zero party data on site. If you need help building this operational machine, book a strategy call with our team.
Once your tracking system is operational, you need to watch the right numbers. These five lag metrics separate serious marketing operators from amateurs. Tracking these data points will instantly elevate your internal reporting.
Lead to Deal Conversion Rate. Experiential marketing leads should convert at a much higher rate than digital ads. According to the 2024 Event Marketer B2B Event Marketing Trends report, trade show leads convert at an average of 11.5 percent. For tracked roadshows in the consumer packaged goods space, post event nurturing pushes this conversion rate to an impressive 18 to 25 percent.
Dealer Confidence Lift. Retailer trust is often the deciding factor in securing prime shelf space. Post roadshow surveys reveal a 34 percent average increase in retailer intent to stock a product. This data comes from a 2024 IRI report analyzing over two thousand shopper marketing activations. Capturing this confidence jump gives your sales team massive leverage with store managers.
Post Event Sales Lift. True impact reveals itself at the cash register. Tracked roadshows drive between 12 and 27 percent in incremental sales during the ninety days following an event. Nielsen research from 2024 tracking 800 fast moving consumer goods roadshows confirms this massive upside. Without a control group to filter out outside variables, you risk misinterpreting this data. Using proper control groups is the key to driving B2B pipeline with roadshows.
Repeat Activation Rate. A successful event makes retail partners want you back. Data from Forrester shows that 62 percent of high performing roadshows lead to repeat retailer partnerships within six months. In the competitive snacks and packaged goods sector, this repeat rate hit 71 percent for fully tracked activations. This metric is a direct reflection of execution quality and staffing consistency on the ground.
Customer Lifetime Value Attribution. Face to face interactions build incredible brand loyalty over time. Analysis from Harvard Business Review in 2025 shows that experiential leads contribute a customer lifetime value that is three times higher than digital leads. A well executed physical trial creates lasting trust that outlasts any online advertising campaign.
Look at a rising beverage brand attempting a major retail expansion this past year. They launched a regional roadshow immediately following a large industry expo. Instead of just counting cups poured, they deployed targeted lag metrics to track performance. They demanded strict accountability from their field teams at every single tour stop.
They established a baseline with local store managers before the tour began. The team used distinct tracking tags for every coupon handed out during the live demos. Over the next ninety days, they tracked point of sale data across participating locations.
The results told a clear and profitable story. They recorded a 19 percent post event sales lift compared to non participating stores. More importantly, their dealer confidence scores jumped dramatically in target regions. Beverage brands averaged an impressive revenue lift per tour compared to their baseline numbers when properly measured.
This measurable proof allowed them to secure prime endcap placement for the next quarter. The initial investment in the roadshow paid for itself several times over. The data transformed an operational expense into a massive driver of sustainable revenue.
Numbers on a spreadsheet are just a reflection of human behavior. When a brand takes the time to measure what happens after the lights go out, they stop guessing. The best operators know that an event is only a promise, and the data is the proof that the promise was kept.

30 Years Experiential & Retail Activation Partner for CPG & Beverage Brands | Multi-Market Demos, Roadshows & Costco/Club Programs That Actually Sell

Since 1995, Makai has been connecting brands with people through live experiences, retail programs, and national activations.