Robbie Thain
Founder, CEO

Maximizing exhibition revenue requires evaluating audience quality, applying a structured scorecard, and modeling total event costs against projected sales.

Choosing the right trade show requires evaluating events as capital investments based on audience quality, commercial fit, total cost, and expected pipeline rather than vanity attendance numbers. This guide provides an operational framework, evaluation scorecard, and portfolio model to help marketing leaders select exhibitions that produce measurable commercial revenue.
Every trade show season begins with optimism and a packed booth. The floor opens to thousands of badges moving through the aisles. Your staff hands out branded merchandise, pours samples, and scans hundreds of lanyards before the lights dim on the final afternoon.
Back at headquarters, the reality sets in. The lead retrieval report shows 800 badge scans, but three hundred are job seekers, two hundred are competitors, and another hundred are service vendors trying to sell to your team. The remaining names lack context, buying authority, or scheduled follow-ups. The sales team ignores the spreadsheet, six figures of marketing budget are gone, and leadership questions whether physical events are worth the capital.
This breakdown happens because marketing teams often select events based on brand fame, organizer marketing materials, and raw foot traffic. When you pick a show because everyone in the industry attends, you treat exhibition space as an obligatory cost instead of an acquisition channel.
Selecting the right trade show demands moving away from presence for the sake of presence. You need a disciplined evaluation framework that filters out low-value floor traffic and prioritizes commercial alignment.
The size of a trade show does not determine its commercial value. A gathering of 50,000 attendees can easily produce fewer qualified opportunities than a 1,200-person vertical summit. The difference lies in attendee density and commercial intent.
Research from the Center for Exhibition Industry Research shows that the exhibition landscape has changed significantly. In late 2024, CEIR reported that exhibitor participation and real industry revenues had rebounded to near 2019 levels. Professional attendance, however, remained 12.9% below the 2019 benchmark. Evaluating a show purely on historic foot traffic or square footage overlooks this shift in attendee composition.
When evaluating an event, divide raw attendance into distinct categories. Every event audience contains buyers, recommenders, researchers, service providers, students, media, and competitors. An event with massive registration numbers may have an ideal buyer density below 5%. Another event with modest attendance might deliver an ideal buyer density of 40%.
Data from Freeman indicates that 93% of exhibitors identify attendee quality as the single most critical event outcome. Furthermore, Freeman found that 87% of surveyed attendees attend events specifically to find new products, solutions, and partners. When attendees arrive with discovery intent, high-density environments create rapid sales velocity.
Instead of asking how many people attend, calculate how many target accounts will be present. Focus on who holds the checkbook and whether their active operational challenges match your core capabilities.
A disciplined event selection process follows four systematic steps. These steps eliminate emotional decision-making, executive bias, and organizer hype.
Every trade show must fulfill an explicit commercial objective. Never select an event without choosing its primary business job first.
If the primary objective is closing enterprise contracts, a broad consumer expo will fail. If the goal is rapid retail product trial, an academic convention will waste resources. Match the event mechanics to the target outcome.
Create an Ideal Attendee Profile before reviewing show prospectuses. This profile sets the standard for acceptable audience quality.
Trade show sales decks highlight total registrations, gross floor space, and past corporate logos. You must verify these claims with hard evidence.
Request an audited attendance breakdown from the organizer. Ask for unique verified professional attendees, excluding booth staff, media, students, and general admission guests. Request past attendee title lists, company rosters, and attendee retention rates across the last three editions.
Validate organizer claims using third-party sources. Review sales team notes from previous years and ask current retail buyers which shows they attend. Check competitor event schedules, inspect social conversation volume, and interview past non-competing exhibitors. If an organizer refuses to share granular attendee data, treat the event as high risk.
Different trade shows serve different stages of the customer buying cycle. Identify where the target audience sits in their decision path.
To evaluate multiple event opportunities objectively, use a weighted scorecard. This tool normalizes comparisons across different industries, formats, and price points.
Assign a score from 1 (poor) to 5 (exceptional) for each of the following eight categories:
Calculate the weighted score using standard arithmetic. Then, multiply the result by an Evidence Confidence Factor to account for data reliability.
An event with an unadjusted score of 4.2 supported only by promotional claims drops to an adjusted score of 2.1. A focused event with a 3.8 score supported by verified buyer lists remains at 3.8. This adjustment prevents teams from over-investing in hyped shows with weak data.
Before approving any event, verify that it passes your baseline operating gates:
Trade show participation requires a commercial financial forecast. Never base approvals on vague brand awareness assumptions. Build a bottom-up pipeline model using unit economics.
Start with target audience size and apply conservative conversion assumptions across each stage:
Compare this gross margin contribution directly against the total cost of execution.
Booth space rental represents only a fraction of the actual capital required. A complete financial model includes all direct and indirect expenses:
If the total execution cost is $60,000 and the projected gross margin contribution is $80,000, the event provides a positive return profile. If total costs exceed $90,000, the economics break down unless lead conversion rates improve.
Run three distinct financial scenarios during the selection stage:
An event should demonstrate viable economics under the base case and manageable downside risk under the conservative case.
Some trade show benefits do not produce immediate revenue but still provide commercial value. Calculate these cost offsets when evaluating overall return:
Document these savings directly in the financial evaluation to present a comprehensive business case.
High-performing brands avoid treating every event with an identical booth build. They build balanced event portfolios with distinct tiers of investment.
Reduce financial exposure by testing new events before purchasing massive floor footprints. Use an escalating participation model over several budget cycles:
By using this ladder, you validate audience quality before committing major capital to custom fabrication and prime floor space.
Once you select the right event, your on-site execution determines whether you realize the projected financial return. Follow this operational playbook to maximize floor performance.
Never rely on passive aisle traffic to hit pipeline targets. A successful show requires extensive pre-event preparation.
For brands planning multi-market footprints, integrating these pre-booked buyer schedules with ongoing field campaigns is critical. Many CPG teams align their convention calendar with regional roadshows to build momentum before meeting major retail category managers.
Booth design must serve functional business operations rather than purely decorative aesthetics. Align the physical footprint with your commercial objectives.
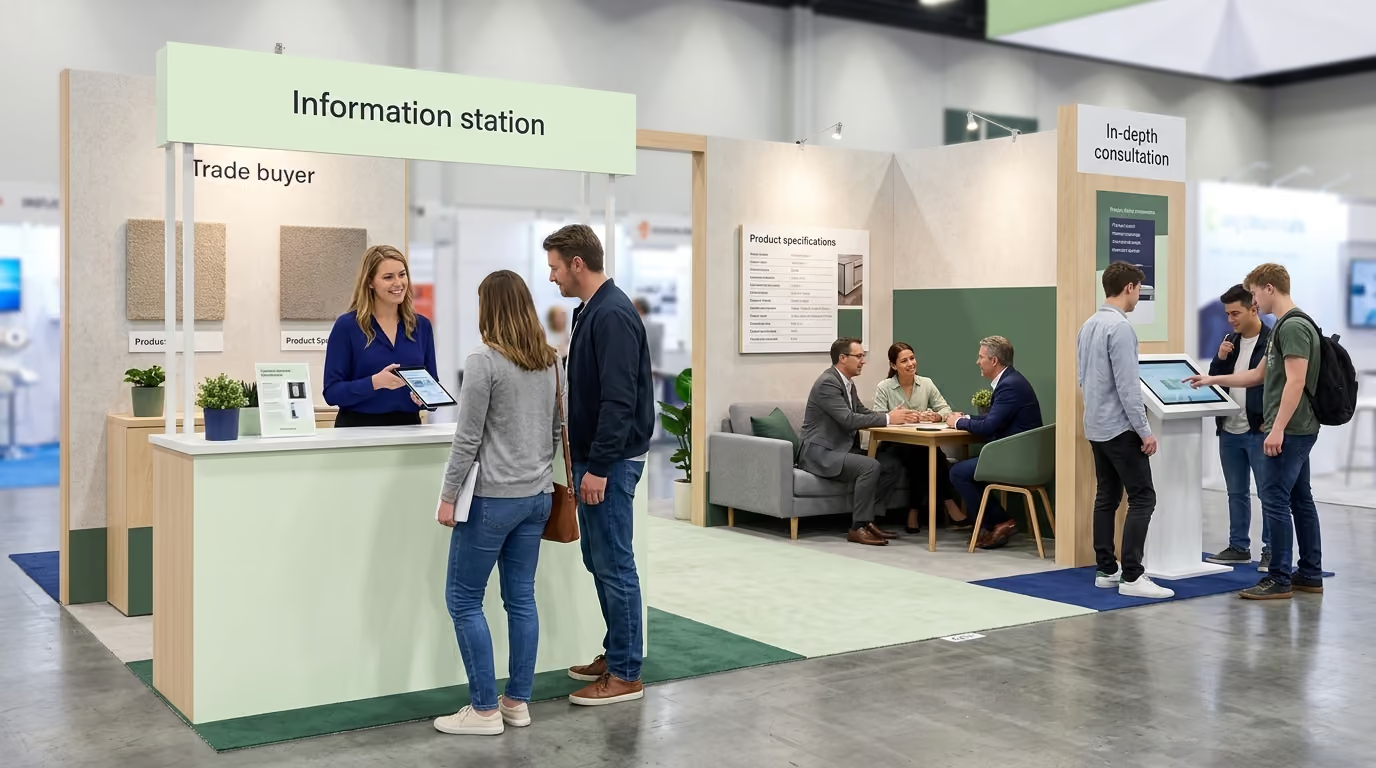
When designing spaces for commercial outcomes, separating high-traffic product trials from serious buyer discussions prevents bottlenecks. Many growing brands achieve this by designing distinct zones for booth design product trials retail buyer meetings that allow simultaneous consumer tasting and retail merchant negotiations.
Train booth staff to qualify visitors quickly. Every conversation should identify commercial potential within three minutes.
Avoid collecting vanity badge scans that lack notes or context. High-performing teams focus on rethinking trade show lead capture to ensure every scanned contact includes actionable qualifying data for post-show sales follow-up.
Booth staff behavior directly impacts commercial performance. Establish clear operational guidelines for every team member on the floor.
Evaluating trade show success requires separating operational activities from commercial business outcomes. Track metrics across multiple time horizons to prove Return on Investment (ROI) accurately.
Track operational volume during the show to manage daily execution:
Measure qualification quality immediately following the event:
CEIR research indicates that 86% of exhibitors track intermediate performance indicators such as lead quality and meeting volume. These metrics provide early indicators of commercial success long before sales cycles close.
Measure bottom-line commercial revenue and pipeline velocity over the full sales cycle:
Recent industry studies highlight this shift in measurement. Exhibitors are increasingly shifting trade show investments toward measurable pipeline rather than relying on unverified brand exposure.
Conduct a formal review sixty days after each event to determine future participation. Assign every show to one of five strategic actions:
Evaluating trade show selection in consumer packaged goods highlights the importance of choosing the right audience format. A premium ready-to-drink beverage brand faced a common portfolio challenge: choosing between a massive national consumer food expo and a focused regional retail buyer summit.
The national food expo boasted over 60,000 attendees, substantial media coverage, and high consumer excitement. The booth real estate, custom construction, drayage, and staffing costs totaled $140,000. Over three days, the team distributed 12,000 product samples and collected 1,500 general consumer badge scans. However, only twelve regional retail buyers visited the booth, resulting in just two formal distribution reviews.
The following quarter, the brand evaluated a specialized retail merchant summit with only 800 total attendees. The entry fee and private meeting suite cost $35,000. The commercial team pre-scheduled eighteen dedicated twenty-minute presentations with category buyers from target grocery and convenience store chains.
The focused summit produced fourteen active retail vendor reviews, resulting in new shelf distribution across 450 regional retail locations within five months. The gross margin contribution from the regional retail accounts exceeded $220,000 in the first year.
A VP of Marketing in the CPG beverage category told us: "Robbie, your leadership and vision turned our campaign into something truly special. The Makai team brought our new drink to life with energy, creativity, and flawless execution. Thanks to you, our brand isn't just tasted, it's remembered."
Our team's approach transformed their product launch into a memorable brand experience. By focusing resources on environments with high buyer density, the brand avoided expensive consumer sampling waste and secured critical retail distribution.
Following successful trade show buyer commitments, many brands expand their retail velocity by connecting trade show leads to retail roadshows. This transition from industry convention visibility to in-store shopper activation ensures that new wholesale distribution turns into sustained consumer sell-through.
Even experienced marketing teams fall into predictable traps when building annual trade show calendars. Recognizing these mistakes prevents wasted marketing capital.
Large crowds often create a false sense of productivity. An exhibit hall filled with students, job seekers, and lower-level practitioners keeps booth staff active while generating zero qualified commercial pipeline. Always evaluate events by the density of target budget holders rather than gross foot traffic.
Exhibiting at an event simply because a direct competitor maintains a large booth is a flawed strategy. Competitors often attend out of habit, executive ego, or multi-year contractual commitments without tracking commercial return. Base your selection decisions on your specific ideal customer profile and financial payback models.
Relying entirely on passive foot traffic walking past your booth leads to inconsistent results. The most profitable trade show executions use the booth as a home base while aggressively driving pre-scheduled meetings, executive hospitality, and targeted networking.
Using pre-pandemic attendance figures or unverified organizer marketing decks leads to poor budgeting. Always verify unique professional attendance trends over the last two years. Account for changes in venue location, organizer management, and registration pricing that influence attendee demographics.
Teams frequently budget for booth space and fabrication while ignoring material handling, union labor, electrical drops, and rig costs. These operational show services often account for 20% to 30% of total spend. Failing to forecast them accurately distorts your cost per lead calculations.
Scanning badges without capturing qualifying project data creates post-show confusion for sales teams. Configure custom qualification surveys within your lead retrieval software to document timeline, budget, current supplier, and agreed next actions on the spot.
Teams looking to maximize their floor presence can review practical tactics for standing out on crowded event floors to ensure their physical footprint attracts qualified buyers rather than casual passersby.
Revisit this selection guide during annual marketing planning, when launching a new product line, or when entering a new retail distribution channel. Review your event portfolio whenever an organizer changes management, when lead costs rise significantly, or when a major show fails to deliver its projected commercial pipeline.
Disciplined trade show selection turns chaotic event marketing into a predictable, revenue-generating acquisition engine.

30 Years Experiential & Retail Activation Partner for CPG & Beverage Brands | Multi-Market Demos, Roadshows & Costco/Club Programs That Actually Sell