Robbie Thain
Founder, CEO

Annual mobile sampling programs align seasonal retail calendars, continuous municipal permitting, modular field logistics.
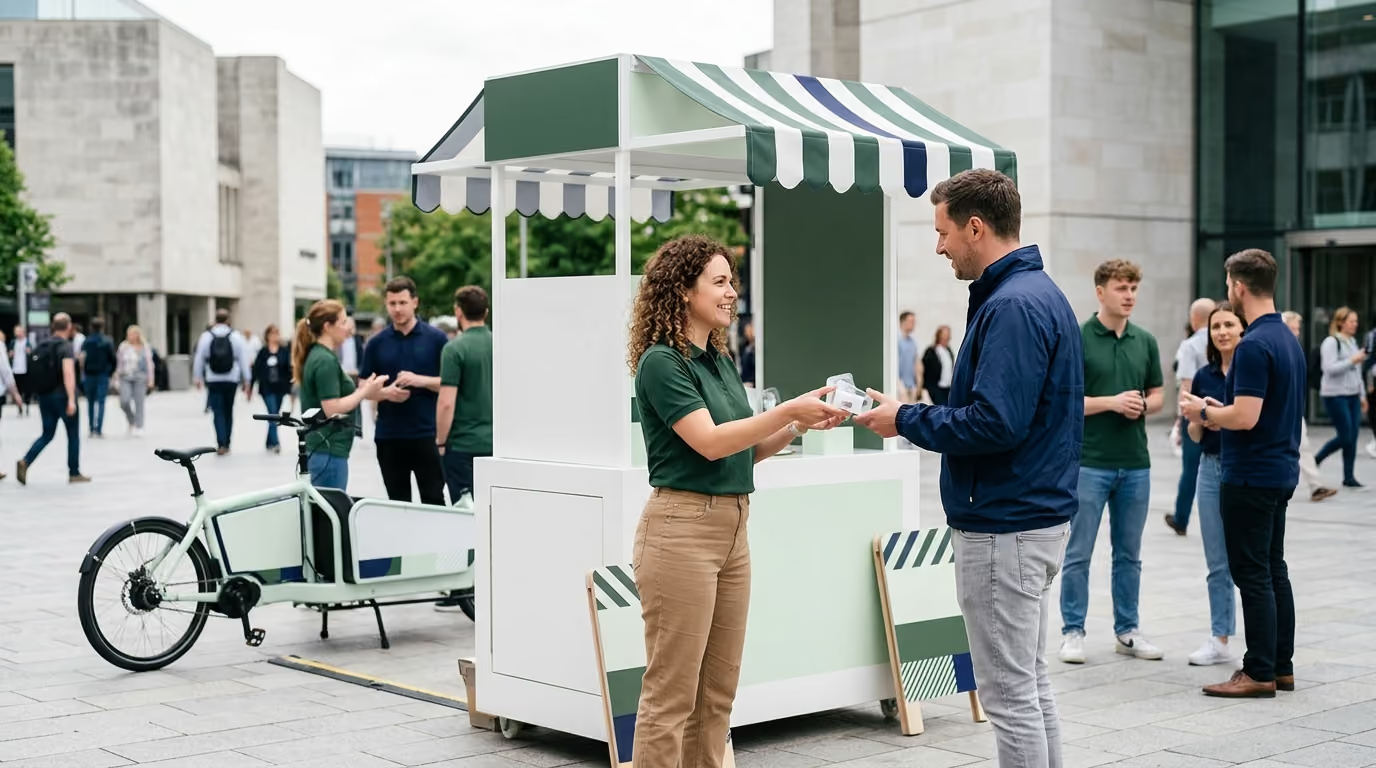
Treating mobile sampling as a series of disconnected, single-city projects drains operational budgets and discards critical market intelligence after every stop. Building an integrated, annual field program transforms fragmented street activations into a cumulative revenue engine that aligns retail calendars, preserves operational momentum, and compounds brand equity over twelve months.
Most brand leaders believe that running five separate mobile activations across a single year provides maximum flexibility. In reality, treating each tour stop as an ad hoc campaign creates friction, inflates vendor costs, and destroys institutional memory. When a team plans a spring tour leg from scratch, tears down the infrastructure, and attempts to rebuild the program six months later, they pay a severe operational penalty.
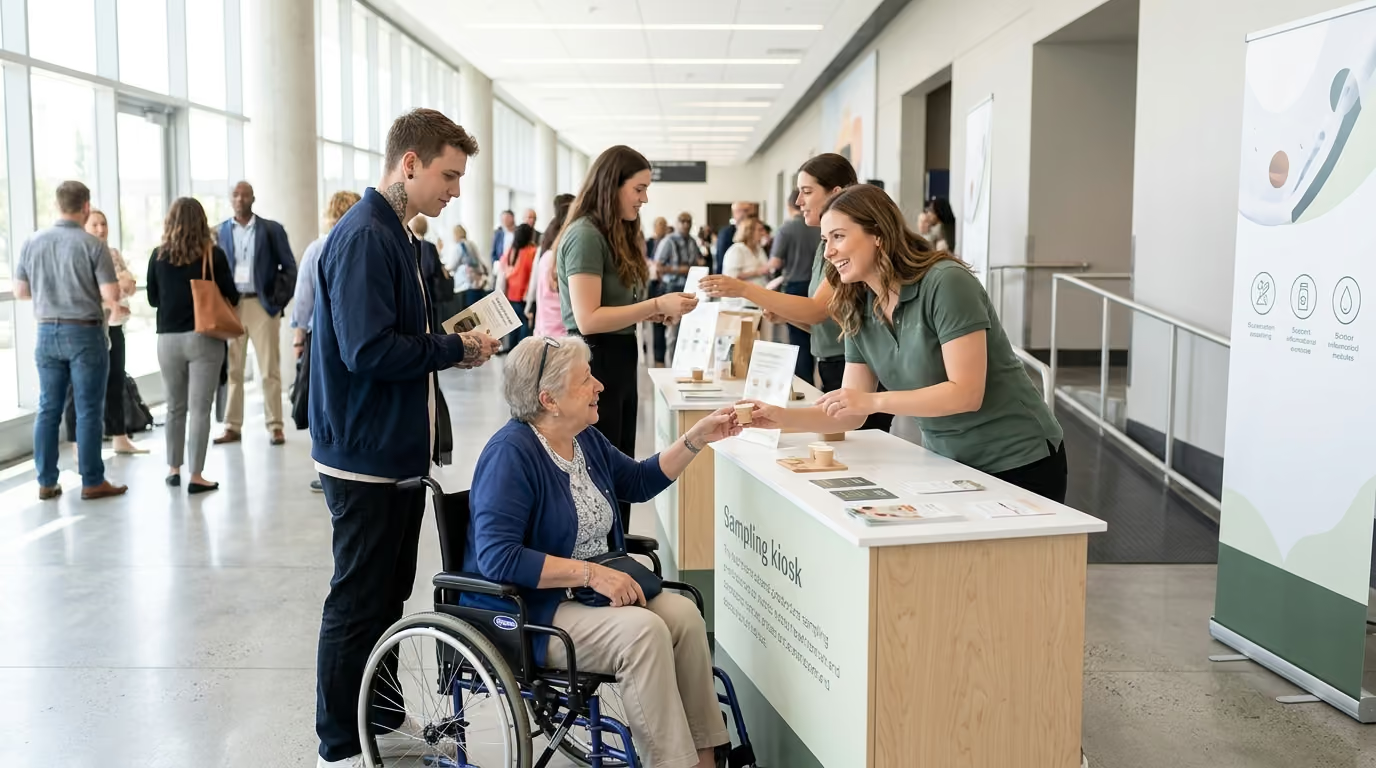
On the live activation floor, this fragmentation reveals itself immediately. Brand ambassadors stand in crowded pedestrian corridors without clear engagement protocols. They hand out product samples to anyone who walks past, logging raw hand-to-hand distribution numbers without capturing consumer sentiment, retail intent, or dietary preferences. The field team views their shift as a quota of units to discard rather than a structured opportunity to qualify potential buyers.
Behind the scenes, logistics rapidly deteriorate under isolated project management. Storage facilities receive damaged vehicle wraps, cracked sampling bars, and missing refrigeration hardware after each short sprint. New local staffing agencies must be sourced, vetted, and trained in every target market, leading to inconsistent brand messaging. Local municipal permits get submitted late because the field team lacks a continuous permitting pipeline.
Worst of all, the data generated from these isolated sprints vanishes into disparate post-event slide decks. Marketing directors receive disconnected summaries highlighting vanity impressions and gross sample counts. Without a persistent measurement framework, executive leadership cannot determine whether a stop in Dallas was more cost-effective than an activation in Denver. Operating as a collection of disjointed experiments leaves field teams exhausted, budgets depleted, and retail partners skeptical of real-world impact.
To build an activation system that produces measurable pipeline, consumer packaged goods brands must treat field marketing as an ongoing operational asset. An annual program operates with unified governance, permanent field leadership, modular assets, and standardized performance metrics. Rather than asking how to execute a specific weekend event, marketing leaders must ask how their mobile infrastructure will support the entire commercial calendar.
In our experience, designing retail demos, product sampling programs, and roadshows that bring brands face to face with their audiences works best when structured around long-term business objectives. Each program must be engineered to drive trial, build consumer relationships, and accelerate retail velocity across multiple key markets over time. Shifting to an annual portfolio model allows your team to negotiate annual fleet leases, secure tiered warehouse storage rates, and maintain a core roster of vetted field managers.
A field study published in the British Food Journal by researchers investigating in-store sampling promotions demonstrates the commercial power of direct product trial. The empirical research confirmed that free sampling is highly effective at inducing product trial among consumers. Furthermore, the study established that sampling creates two distinct commercial pathways: it encourages brand switching among consumers who already plan to purchase within the category, and it brings entirely new consumers into the category who had no prior purchase plan.
The study also demonstrated that direct interpersonal interaction with the staff distributing the sample significantly increases post-trial purchase incidence. An annual mobile sampling program provides the sustained framework required to exploit these behavioral dynamics across different markets.
To maximize these effects, an annual sampling portfolio should assign one of three specific operational mandates to every scheduled tour window:
Recruitment activations focus on introducing unfamiliar products to consumers who do not currently shop the category. These stops occur in lifestyle environments, transit hubs, fitness centers, and entertainment districts where foot traffic is high and dwell time allows for meaningful conversation. The primary operational objective is overcoming taste or functional skepticism through immersive, guided product education.
Switching activations target consumers who actively purchase competing products within the same category. These stops are deployed near high-density retail corridors, grocery parking plazas, and commercial shopping centers. Field teams emphasize product differentiation, ingredient quality, and immediate price promotions to intercept planned purchases and divert retail demand to the featured brand.
Reinforcement activations return to high-performing historical markets where initial trial and retail distribution have already been established. These deployments validate consumer retention, support local retail partners during competitive resets, and reward loyal brand advocates with exclusive merchandise or product line extensions.
Building an annual field marketing calendar requires synchronizing brand activations with macro consumer demand and retail execution windows. Deploying a mobile sampling fleet without verifying retail inventory availability leads to wasted consumer interest and broken commercial attribution. A mobile tour must pull shoppers directly toward store shelves that are fully stocked with promotional inventory.
A global consumer study published by YouGov on the path to purchase for seasonal events analyzed consumer buying habits across 18 international markets. The research established that food and beverages represent the single most commonly purchased category during seasonal shopping periods, reported by 78% of global seasonal event purchasers. The data revealed that food and beverage demand peaks dramatically during family-centric seasonal windows, purchased by 87% of Christmas shoppers and 90% of Easter break shoppers.
These findings demonstrate that consumer responsiveness to food and beverage sampling fluctuates across the calendar. Rather than running a continuous, flat activation schedule throughout the year, brands must build an annual calendar that expands and contracts around high-leverage retail windows.
When mapping out the twelve-month deployment schedule, field marketing leaders should balance four interlocking operational dependencies:
Identify the natural peak consumption periods for your product portfolio. Cold beverages, RTD teas, and frozen novelties demand heavy field deployment across late spring and summer. Functional immunity shots, warm nutrition products, and baking ingredients require aggressive sampling across fall and winter quarters.
Align mobile tour stops with national grocery and mass retailer promotional schedules. Major retailers plan shelf resets, endcap promotions, and circular features months in advance. Coordinating your mobile sampling footprint to arrive in a regional market during a scheduled retail feature maximizes promotional lift and strengthens retail buyer relationships.
Public property permits, park district approvals, and street vending licenses require substantial administrative lead times. An annual planning framework allows brand teams to submit municipal permit applications six to nine months in advance. This eliminates emergency expediting fees and prevents costly last-minute route adjustments.
Winter tour legs in northern states present serious logistical hazards, including frozen plumbing systems, compromised vehicle mechanics, and depressed pedestrian foot traffic. An optimized annual route moves southward and westward during cold-weather months, targeting indoor venues, winter sports destinations, or sunbelt metropolitan areas before heading north for the spring and summer. You can read more about planning these regional transitions in our guide to high-performance tour routing.
An annual mobile sampling program is an ongoing market learning engine. However, gathering actionable intelligence across twelve months requires strict measurement standardization. If the Dallas team tracks total foot traffic while the Chicago team records distributed napkins, the marketing organization cannot generate cumulative insights.
Industry research highlights both the prevalence and the historical fragmentation of experiential marketing analytics. Event Marketer's Event Measurement Benchmarking Report surveyed over 200 event marketing executives and agencies across major enterprise sectors. The report found that among consumer brands, 87% tracked total event visitors or attendees, 64% measured social media lift, 61% tracked direct sales generated from the experience, and 59% measured attendee satisfaction and Return on Investment (ROI).
The study revealed that 59% of consumer brands used benchmarking against historical data to evaluate performance, while 86% utilized event metrics to guide future activations.
To establish a defensible measurement spine across an entire year, marketing directors should structure their data collection into four distinct operational layers:
Establish precise operational definitions for field interactions to avoid inflated reporting. Track pedestrian volume in the activation zone, total consumers approached by staff, completed one-on-one brand conversations, direct product trials consumed on site, and take-home packages distributed. Enforcing these operational distinctions ensures that raw sample distribution is never conflated with verified product trial.
Measure the depth of the live brand interaction. Use intercept tablet surveys to capture message recall, product flavor ratings, purchase intent scores, and demographic profiles. Maintain a core set of identical survey questions across all twelve months to benchmark market receptivity accurately.
Track immediate behavioral conversion through trackable incentives. Distribute serialized digital coupons, unique QR scan codes tied to local retail partners, or direct retail bounce-back incentives. Tracking redemption rates by city, venue type, and staffing crew reveals which activation environments drive immediate retail purchases.
Evaluate the medium-term impact of mobile sampling on retail sell-through. Compare syndicated point-of-sale scanner data in activated metropolitan markets against matched control markets that received no field support. A structured overview of these analytical frameworks is available in our resource on measuring mobile sampling impact.
The Event Marketer benchmarking study noted that 63% of consumer brands evaluate event outcomes over a zero-to-three-month window, while only 14% maintain measurement windows extending from six to twelve months. An annual program must bridge this gap by publishing rapid 48-hour post-activation recaps while maintaining a cumulative dashboard that tracks long-term retail velocity across consecutive quarters.
The financial and operational efficiency of an annual mobile program relies heavily on asset preservation and labor continuity. Discarding custom fabrication materials or completely restaffing field teams between tour legs introduces massive operational drag. A mature field program treats its physical footprint and human talent as permanent capital assets.
Physical assets must be engineered for modularity, durability, and rapid repair. A mobile tour infrastructure should feature heavy-duty commercial vehicles, custom-fabricated display elements, commercial refrigeration units, and weather-resistant structural components. Standardizing your physical footprint across all markets ensures predictable setup times, lowers freight transit costs, and protects the brand's visual identity.
To maintain physical assets effectively across a multi-city schedule, implement the following operational controls:
Labor continuity is equally vital for brand safety and conversion performance. Constantly cycling through unvetted local staff leads to poor product presentations, inconsistent product talking points, and low consumer conversion. An annual program solves this by retaining a dedicated traveling tour manager and regional lead brand ambassadors.
Our team maintains consistent operational discipline by utilizing field team staffing strategies that emphasize extensive product certification and continuous performance tracking. Traveling field managers provide operational stability, supervise local brand ambassador hires, enforce health department sanitation codes, and manage live inventory counts.
Retaining core field leadership across multiple tour legs reduces onboarding friction, eliminates repetitive operational training, and ensures consistent consumer engagement across every market.
Turning an annual strategy into seamless street execution requires an explicit operational playbook. Every market stop, retail parking lot demo, and guerilla intercept must follow a standardized sequence of operational milestones. This disciplined execution model ensures brand consistency, protects public safety, and maximizes consumer throughput.
Measuring the performance of an annual sampling program requires monitoring both immediate operational indicators and long-term financial returns. Lead metrics evaluate the daily operational efficiency of the field crew, while lag metrics confirm whether the program successfully generated commercial value for the business. Tracking both categories across every tour leg creates a transparent, data-driven narrative for executive stakeholders.
To maintain an accurate analytical baseline, program directors should evaluate performance across three reporting cadences:
Consolidate individual market data into an executive performance dashboard updated monthly. This dashboard must cross-tabulate performance across markets, seasonal quarters, product flavors, and staffing teams. Comparing these variables reveals which regions deliver the lowest cost per trial and which venue environments generate the highest long-term retail conversion.
Review our detailed analysis of sampling programs that drive retail sell-through to see how leading consumer brands use point-of-sale tracking to validate field marketing expenditures.
To understand how these principles function in the commercial marketplace, consider the operational blueprint of a emerging functional beverage brand executing an annual multi-market tour. Facing intense competition in the ready-to-drink functional beverage category, the brand needed to drive verified consumer trial, support its expansion into 2,500 conventional grocery stores, and maintain high operational efficiency across twelve months.
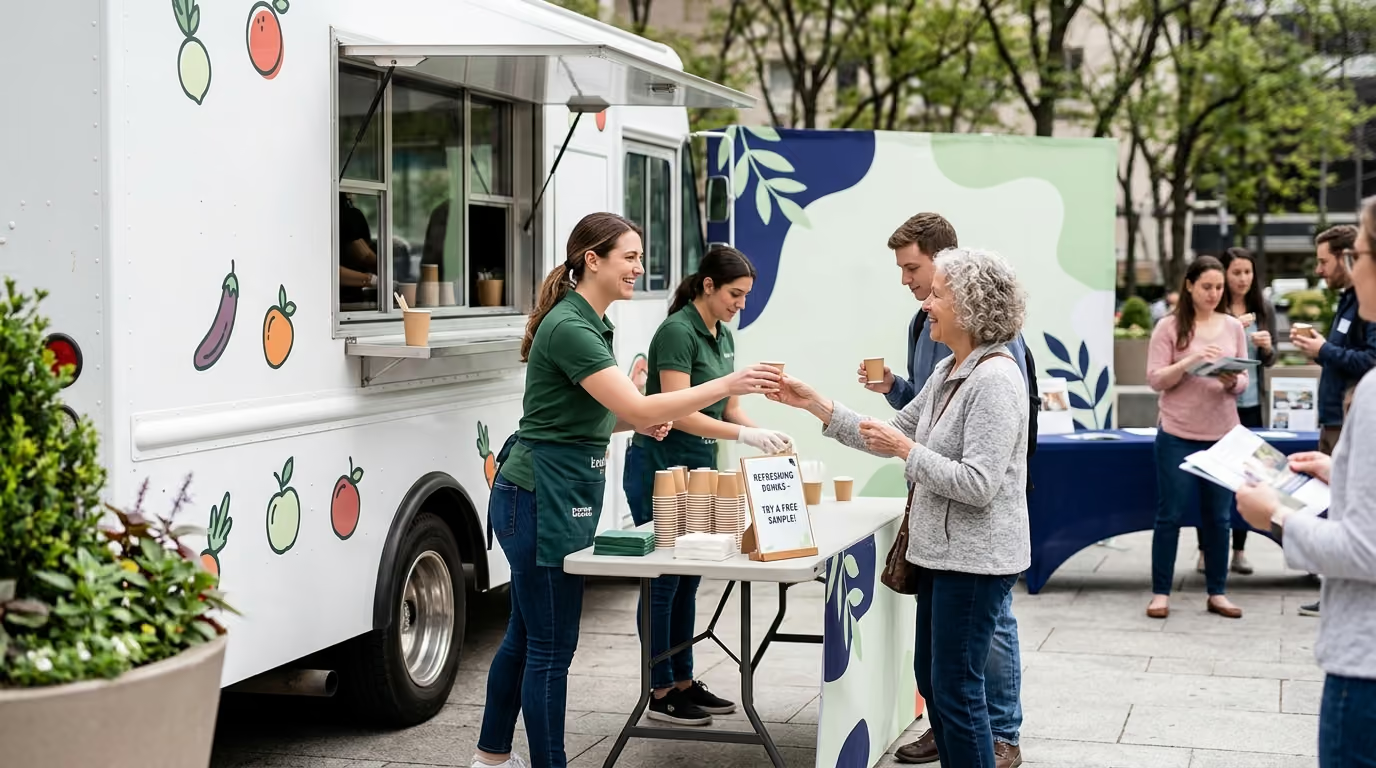
Instead of booking sporadic, isolated weekend festivals, the brand built an integrated four-quarter mobile sampling and guerilla marketing program. The tour operated with a single custom-fabricated mobile sampling vehicle, modular footprint assets, and a traveling tour manager who supervised local brand ambassador teams in each target metropolitan market.
The program launched in January across Southern California, Arizona, and Texas to capitalize on favorable outdoor weather and consumer fitness resolutions. Deployments focused on lifestyle corridors, running events, and suburban shopping centers to introduce the product's functional benefits to health-conscious consumers. The team established baseline performance benchmarks, achieving an average cost per verified trial of $2.10 while testing three distinct messaging variations across 45 activation days.
As retail distribution expanded into major supermarket chains across the Midwest and Southeast, the tour pivoted from general lifestyle recruitment to aggressive retail switching activations. The mobile vehicle staged high-impact parking lot activations at approved retail centers, while foot-canvassing guerilla teams sampled consumers along adjacent walking routes. Each consumer received a chilled sample and a trackable $1.50 coupon redeemable at the adjacent grocery retailer, driving immediate store traffic and generating a 22% coupon redemption rate.
During peak beverage consumption months, the tour moved into northern metropolitan markets, activating at beachfronts, food festivals, and public parks across Chicago, Minneapolis, and Detroit. The field crew utilized high-capacity rapid-pour sampling bars and deployed roaming backpack squads to maximize throughput during high-density events. Daily sample distribution increased by 65%, driving down the average cost per trial to $1.35 while generating massive brand visibility across key urban markets.
The final quarter focused on returning to the brand's top-performing grocery markets to reinforce customer retention and support seasonal holiday multipack promotions. Activations were concentrated around high-traffic urban transit hubs, shopping districts, and holiday pop-up markets. The annual data engine consolidated performance metrics across 180 total activation days, allowing brand executives to present verified retail velocity lift numbers to retail buyers during annual category reviews.
Building an annual field marketing program requires navigating continuous operational, environmental, and human variables. Marketing directors who fail to anticipate these challenges frequently fall into predictable traps that undermine program performance and inflate overhead expenses.
Never allow field teams to report passive foot traffic or gross impressions as primary success metrics. A consumer who walks past a branded vehicle without interacting has not experienced the brand. Insist on tracking physical, verified product trials where consumers directly taste, touch, or test the product and engage in substantive brand dialogue.
Scheduling aggressive mobile activations around grocery retailers without confirming distribution warehouse inventory leads to out-of-stock shelves. Always confirm that regional distribution centers and local store backrooms have sufficient inventory before routing mobile teams to specific retail accounts. When stores run out of stock during an activation, consumer purchase intent is permanently lost.
Mobile marketing vehicles endure significant mechanical wear during twelve-month nationwide tours. Failing to establish dedicated maintenance contingency funds and backup logistics plans results in canceled tour stops when vehicles require mechanical repairs. Build 48-hour mechanical buffer windows into your annual route and maintain accounts with national equipment rental providers to deploy replacement footprints instantly if a vehicle breaks down.
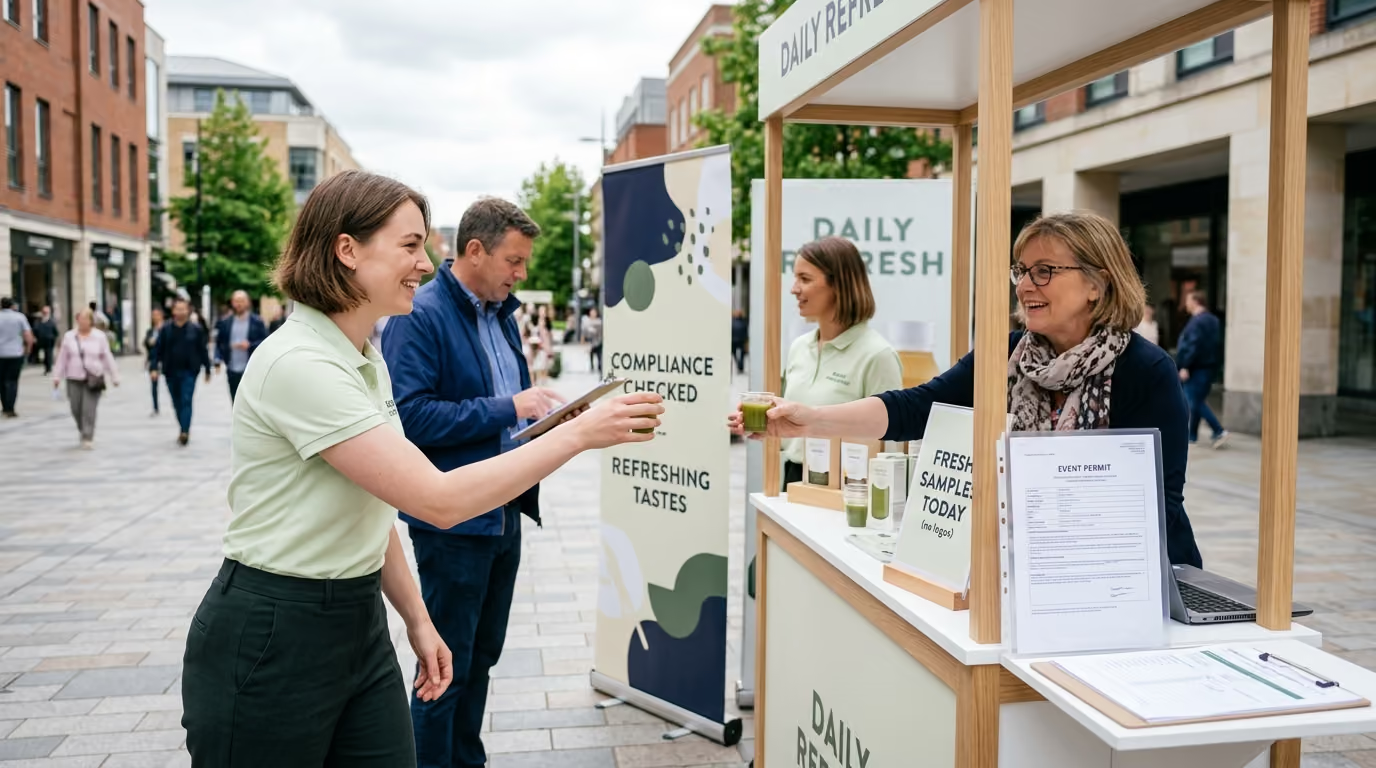
Local municipal street vending ordinances, fire codes, and health department regulations vary drastically across adjacent municipalities. Never assume that a permit issued in one city allows street vending in a neighboring suburb. Maintain a comprehensive compliance database, ensure all field leads hold active food safety manager certifications, and conduct routine audits of field sanitation protocols.
Operating an annual mobile sampling program transforms real-world brand engagement from an unpredictable expense into a disciplined, scalable growth engine for modern consumer brands.

30 Years Experiential & Retail Activation Partner for CPG & Beverage Brands | Multi-Market Demos, Roadshows & Costco/Club Programs That Actually Sell