Robbie Thain
Founder, CEO

Measuring field campaigns requires an eight-layer architecture that links qualified consumer engagement directly to retail sales lift and financial returns.
Measuring the commercial return of field activations requires tracking actual consumer behavior rather than simple operational hand-outs. By connecting verified field interactions directly to store-level retail velocity and long-term cohort retention, brand leaders can isolate true incremental profit from baseline noise.
Field marketing teams often celebrate the sheer volume of handed-out product samples while retail shelves tell a completely different story. A branded van parks on a crowded metropolitan corner, handing out thousands of chilled beverages or snack bars in a four-hour window. The team returns with photos of smiling crowds, logs depleted inventory, and marks the day as an unqualified win. Yet when the regional sales director reviews scanner data the following week, units sold at nearby grocery stores remain flat. The campaign generated activity, but it failed to create demand, leaving executives to wonder whether live activations build lasting brand equity or merely burn marketing capital.
This breakdown between field activity and commercial impact occurs because most organizations measure execution rather than effect. Counting physical samples handed to passersby describes what your team did, not what the consumer decided to do next. To prove true Return on Investment (ROI), marketing leaders must replace superficial tallies with a causal measurement architecture. This resource provides an operator-grade framework to isolate incrementality, quantify retail lift, track repeat purchases, and turn physical consumer experiences into verifiable pipeline growth.
The most common failure in experiential marketing is treating logistical milestones as business outcomes. Handing out ten thousand product units on a boardwalk demonstrates logistical capability. It does not prove that you changed consumer purchase behavior, recruited new buyers, or increased category share.
When field teams report only top-line distribution numbers, they introduce dangerous blind spots into the marketing mix. A high sample count can easily hide severe operational flaws. If your staff hands products to consumers who already purchase your brand weekly, you have subsidized existing demand rather than generating new revenue. If staff gives samples to consumers who immediately discard them in a nearby trash bin, you have paid premium field labor to generate waste.
Academic research on promotional sampling identifies three distinct consumer responses: acceleration, cannibalization, and expansion. Acceleration occurs when an existing customer buys your product earlier than planned. Cannibalization happens when a free sample replaces a paid purchase that the consumer would have made anyway. Expansion occurs when sampling induces a non-buyer or competitor loyalist to enter your brand ecosystem. A sound measurement system must separate pure expansion from cannibalization, ensuring your marketing dollars drive real growth rather than vanity volume.
To evaluate real performance, your measurement model must follow an unbroken sequence of consumer touchpoints:
Tracking this chain requires discipline. It forces your team to interrogate what would have occurred if your activation truck had never arrived.
A comprehensive measurement program operates across multiple structural layers. Each layer isolates a specific stage of the consumer journey, providing diagnostic clarity when a campaign overperforms or falls short of revenue goals.
Measurement begins before fabrication, routing, or staffing schedules are finalized. Every mobile activation or street-level installation must solve a clearly defined commercial problem.
Common objectives include accelerating velocity in underperforming retail accounts, supporting a new SKU rollout, defending shelf space against an aggressive competitor, or acquiring verified first-party consumer data. Each distinct objective dictates a different primary metric. A retail velocity push requires matched-store scanner tracking, while an email acquisition initiative prioritizes cost per verified subscriber.
Define your operational decision rules during the planning phase. Establish the exact incremental unit threshold required to justify expanding the tour into secondary markets. A rigorous brief outlines the target demographic, geographic control markets, historical baseline sales windows, and the post-campaign attribution timeframe. For a deeper breakdown of structural metrics, review our experiential measurement stack for CPG impact.
Raw footfall figures published by municipal authorities or venue operators are fundamentally flawed. A pedestrian density count tells you how many individuals walked down a street, not how many saw your brand.
Break exposure into precise tiers:
Measure the cost per qualified contact across different venues and market types. A college campus stop may generate thousands of low-cost raw impressions, while a corporate park tour delivers a higher concentration of qualified high-income households at a lower cost per meaningful conversation.
Superficial interactions produce weak commercial outcomes. A five-second interaction where a consumer grabs a sample and walks away rarely changes long-term brand preference.
Track the depth of participation through standardized engagement metrics. Measure approach rates, demonstration completion rates, and average dwell time. Dwell time provides valuable insight into brand immersion, though it must be interpreted carefully. Long dwell times caused by inefficient queuing or confusing activation layouts indicate operational friction rather than positive brand affinity. Pair dwell metrics with exit interviews to evaluate message comprehension and perceived product differentiation.
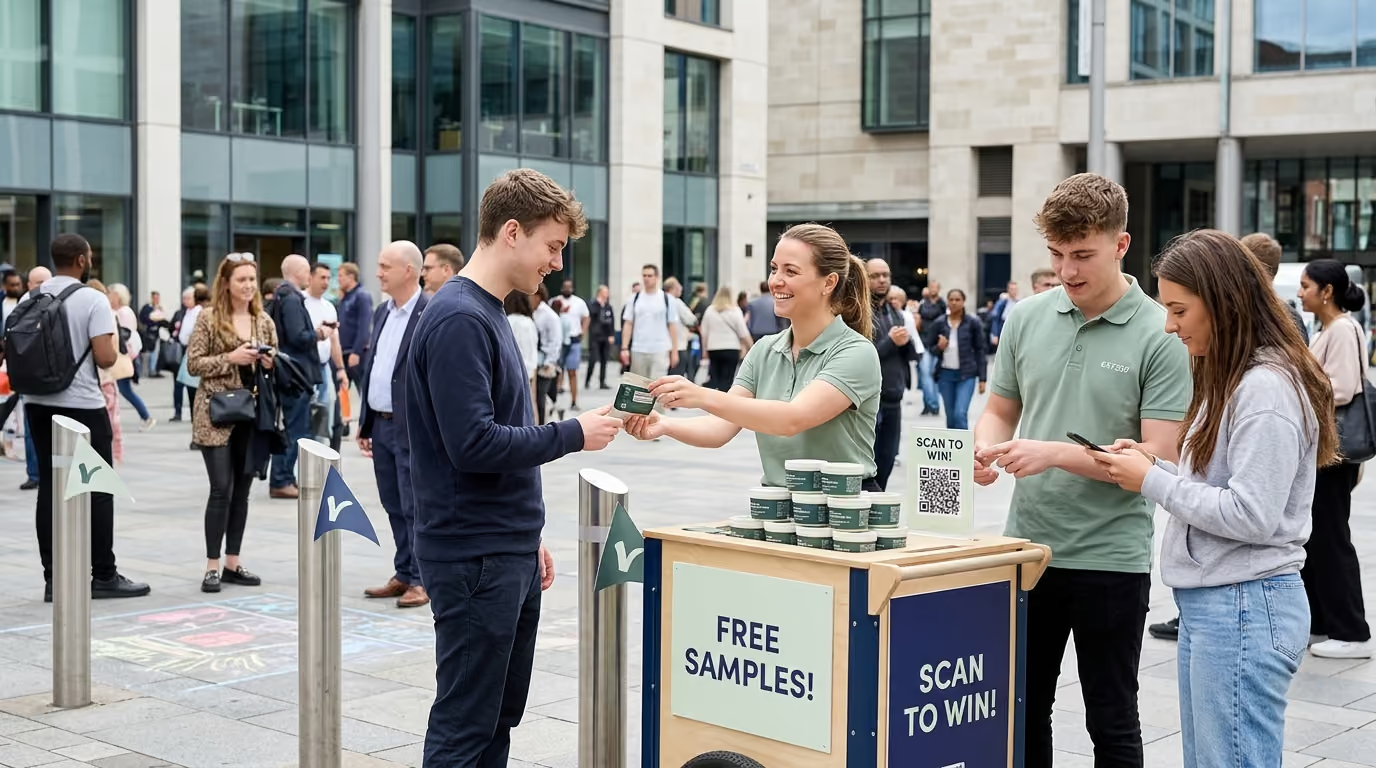
First-party data capture serves as the digital bridge for physical activations. Capture verified email addresses, mobile numbers, and consumer preferences through interactive digital games, receipt uploads, or custom QR scans. Assess each captured record for validity, consent compliance, and downstream matchability against customer relationship management systems.
A sample handed out is not identical to a sample consumed. In field operations, a notable percentage of distributed products are pocketed, forgotten, or thrown away uneaten.
Train field teams to log trial metrics with precision. Track samples prepared, samples accepted, and verified on-site consumption rates. Record labor hours per consumed sample to measure field staffing efficiency. Distributing ready-to-eat bites or chilled, opened beverage pours significantly increases immediate consumption rates compared to handing out sealed multi-packs, which are vulnerable to delayed consumption or loss.
Capture immediate sensory feedback through brief intercept surveys administered on tablets. Measure whether the consumer perceived the key flavor profile, nutritional benefits, or packaging innovations. Immediate trial metrics provide rapid feedback on product formulation and brand positioning before you scale national retail distribution.
For consumer goods, the ultimate test of field marketing is moving units off retail shelves. Track retail impact by monitoring point-of-sale scanner data in stores located within the immediate trade radius of each activation stop.
Evaluate both unit velocity and gross dollar sales during the campaign period and throughout the subsequent four to eight weeks. Differentiate between immediate sales spikes caused by on-site pop-up sales and sustained velocity gains in local retail partners like grocery stores, club stores, and mass retailers. When managing expansive multi-market campaigns, you can explore how multi-city sampling tours drive trial while establishing localized retail sales lift baselines.
Monitor out-of-stock rates closely during retail sampling pushes. A successful field activation that drives shoppers to an empty retail shelf destroys value by paying for customer acquisition while frustrating both the consumer and the retail buyer.
Initial conversion spikes can deceive marketers if the newly acquired consumers never make a second purchase. Real enterprise value stems from turning a single trial moment into ongoing category consumption.
Establish customer tracking cohorts based on activation dates, geographic zones, and specific retail partner engagements. Monitor repurchase rates across designated intervals:
Track the percentage of trial participants who transition into full-price retail buyers without needing ongoing promotional incentives. Cohort analysis reveals whether your field activation attracted loyal brand advocates or merely transient bargain hunters.
Guerilla marketing stunts, public art takeovers, and high-impact visual pop-ups often produce business value through delayed psychological preference rather than immediate impulse purchases.
Deploy matched-market brand lift surveys to measure changes in unaided awareness, aided recall, message attribution, and overall brand favorability. Compare responses from consumers located in activation target zones against unexposed control demographics in demographically similar regions.
Monitor localized search dynamics during and immediately following the activation window. Track increases in branded query volume, product-plus-benefit searches, and "where to buy" retail locator clicks originating from activation postal codes. Search lift acts as an early indicator of consumer purchase intent, bridging the gap between real-world visual disruption and downstream digital or retail commerce.
A campaign that generates substantial revenue can still result in a net financial loss if variable production, logistics, and staffing costs exceed the gross margin generated by incremental sales.
Calculate your Return on Investment using net incremental contribution margin rather than top-line revenue. Subtract all variable product costs, freight, warehouse storage, staffing fees, city permits, event space rentals, and agency management fees from the gross profit generated by incremental units sold. Evaluating campaigns through contribution profit prevents brand leaders from confusing expensive gross revenue growth with true enterprise profitability.
Proving causality requires establishing a rigorous counterfactual. You must determine what sales volume would have occurred in a specific territory if your mobile activation team had never set foot there.
The most reliable retail measurement method pairs activation stores with statistically matched control stores. Select a group of retail locations in the activation market that sit directly within the drive-time zone of your tour stops. Then, identify an equal number of non-activation control stores in adjacent or demographically equivalent markets.
Control stores must be matched across specific operational criteria:
Calculate the difference-in-differences to isolate the campaign effect:
Subtract the pre-campaign baseline sales from the post-campaign sales in both groups. Then, subtract the control group's sales movement from the test group's sales movement. This calculation removes external variables such as seasonal holiday surges, category-wide inflation, or national supply chain disruptions, leaving only the pure incremental lift generated by the field activation.
When executing expansive mobile tours or high-visibility guerilla takeovers across entire designated market areas (DMAs), store-level isolation becomes challenging. In these scenarios, use geographic holdout markets to evaluate macro performance.
Select three to five activation DMAs and pair them with three to five control DMAs that share similar historical brand market shares and media consumption habits. Run the physical activation exclusively in the test DMAs while maintaining normal marketing operations in the holdout regions. Compare regional sales trends before, during, and twelve weeks after the campaign to identify geographic lift. Discovering actionable methods for measuring sales lift will help clarify how geographic holdouts isolate field impact from broader marketing efforts.
A rigorous field experiment structure eliminates internal debates regarding attribution. When the finance team questions campaign efficacy, matched-market data provides clear, defensible evidence of incrementality.
Accurate measurement requires meticulous operational discipline. If your field staff fails to log data correctly or if retail tracking tags are improperly configured, post-event analysis collapses into guesswork.
A balanced dashboard combines operational lead indicators with commercial lag metrics. Lead metrics allow field managers to adjust tactics mid-tour, while lag metrics prove final business value to the executive leadership team.
To calculate Incremental Lift Percentage across matched store groups, use the following formulation:
Incremental Lift Percentage equals the test store post-period sales minus test store pre-period sales, minus the control store post-period sales minus control store pre-period sales, divided by the control store pre-period sales, multiplied by one hundred.
To establish Net Campaign Return on Investment based on financial margin, apply this formula:
Campaign Return on Investment equals the total incremental contribution profit minus total campaign expenditures, divided by total campaign expenditures, multiplied by one hundred.
Using contribution profit rather than gross revenue prevents distorting returns on products with high variable manufacturing or distribution expenses. For more on organizing these indicators, read our guide on building a field marketing measurement system.
Guerilla marketing interventions and mobile tours generate consumer value beyond direct sample hand-offs. They create visual spectacles that drive digital conversation, branded search queries, and long-term brand equity.
To measure psychological shifts among consumers who may not have purchased immediately, execute structured brand lift research.
Recruit an exposed audience group through mobile geofencing around the activation site during live event hours. Simultaneously recruit a control group of consumers with matching demographic profiles located outside the activation market. Administer identical survey questions to both groups, evaluating unaided brand recall, category consideration, perceived product premiumness, and intent to purchase within the next thirty days.
Report brand lift using absolute percentage-point gains rather than relative percentages. Moving unaided awareness from four percent to eight percent represents a one hundred percent relative gain, but reporting an absolute lift of four percentage points provides a far more realistic foundation for executive financial modeling.
When an eye-catching mobile activation or unconventional guerilla installation halts foot traffic, consumers reach for their smartphones.
Monitor Google Trends, search console metrics, and local search term volumes across specific activation metropolitan areas. Track targeted query categories:
Compare search query velocity in activation postal codes against control markets before, during, and four weeks after the event. A sustained elevation in local search activity confirms that the physical activation penetrated consumer awareness and created ongoing product consideration.
Guerilla activations frequently aim to generate viral social media impressions and traditional press coverage. However, treating estimated media impressions as verified business value is a major pitfall.
Avoid relying on standard Earned Media Value formulas that claim an organic Instagram mention or TikTok view is equivalent to paid advertising placement. Instead, track concrete engagement depth:
Earned media acts as a multiplier of physical reach. It should be reported as an amplification channel that expands top-of-funnel reach rather than as direct financial profit.
To understand how this measurement architecture functions in practice, consider a national emerging functional snack brand launching a multi-market mobile sampling tour across six major metropolitan regions.
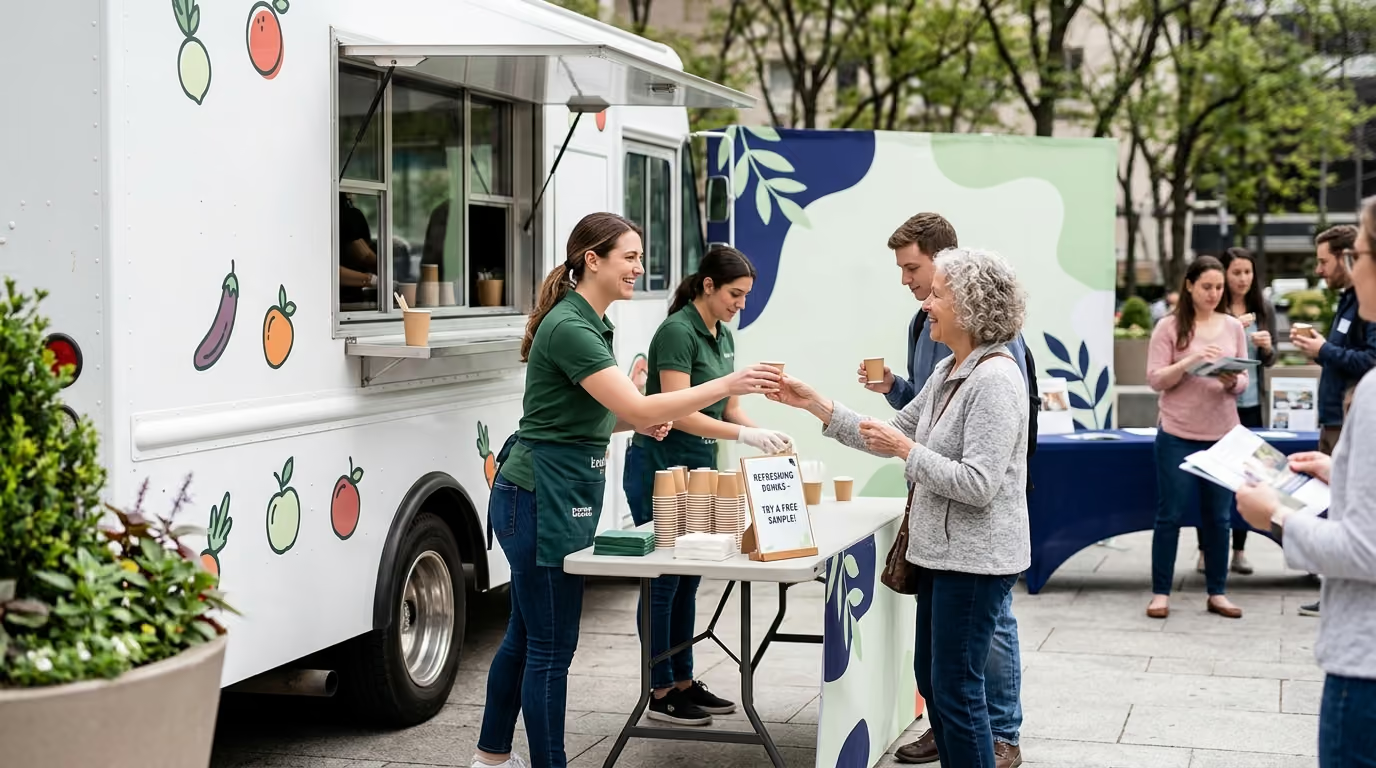
The brand's primary strategic goal was driving retail velocity across three national grocery banners where the product had recently gained distribution. The field marketing team deployed a custom branded sampling vehicle to execute high-energy pop-up events near high-volume grocery locations, fitness centers, and community parks.
We create experiential marketing programs built to connect emotion with action. Our process blends creativity, strategy, and data to ensure every brand interaction drives measurable results. We craft experiences that engage all five senses, helping people not just see brands, but feel them, turning moments into meaningful business outcomes. In our experience, campaigns succeed commercially only when field teams maintain strict operational discipline around data logging and matched-market retail tracking.
The field team executed sixty individual activation stops over an eight-week tour window. At each location, trained brand specialists distributed chilled, single-serve product portions while delivering a concise thirty-second product value presentation.
Brand ambassadors used handheld digital tablets to log real-time consumer interactions, capture intercept survey responses, and distribute serialized digital coupons redeemable exclusively at local partner grocery stores. Every coupon contained a distinct tracking code tied directly to the specific vehicle stop, date, and staffing shift.
Over the course of the campaign, the field team logged the following operational metrics:
To evaluate true incremental sales lift, the analytics team paired forty-five grocery stores within a three-mile radius of activation stops with forty-five demographically matched control stores located in adjacent non-activation markets. Baseline sales were established using scanner data from the twelve weeks preceding the campaign.
The resulting difference-in-differences analysis revealed striking commercial results:
The total campaign budget, covering vehicle wrapping, logistics, field staffing, product samples, event permits, and management fees, equaled $185,000.
The product carried a retail price of $3.49 per unit, with the brand realizing a wholesale revenue of $2.10 per unit and a variable unit contribution margin of $1.15 after accounting for manufacturing, packaging, and freight costs.
The direct financial return was calculated as follows:
While the campaign did not achieve immediate cash payback within the first eight weeks, tracking long-term cohort value demonstrated that the tour significantly reduced customer acquisition costs compared to digital paid advertising channels while establishing durable retail velocity. To see how specialized event staffing drives these real-world conversion figures, explore our complete guide to staffing mobile sampling activations.
Measuring real-world activations presents operational challenges that can compromise your data if left unmanaged. Recognizing common methodological pitfalls protects your analytics team from drawing incorrect commercial conclusions.
In post-trial exit surveys, consumers frequently report high purchase intent. Over eighty percent of surveyed participants often claim they intend to buy the sampled product during their next grocery trip.
Self-reported intent is heavily influenced by social desirability bias and the pleasant nature of a free interaction. Consumers want to be polite to enthusiastic brand ambassadors. In reality, actual conversion rates from intent to verified retail purchase typically range between five and twenty percent. Always treat purchase intent as a directional diagnostic indicator of product liking rather than a reliable financial projection.
A field activation can successfully convince hundreds of consumers to buy a product, but if local store shelves are empty, your marketing investment is wasted.
When retail scanner data shows zero sales lift following an activation, evaluate inventory availability before concluding the marketing campaign failed. If your product was out of stock or relegated to an unfindable top-shelf location, the failure lies in supply chain execution rather than consumer demand. Integrate daily retail store checks into your field team's operational responsibilities to verify distribution readiness.
Aggregating all tour data into a single national performance average hides critical local successes and failures.
A mobile tour may generate a remarkable four hundred percent Return on Investment in secondary suburban markets while suffering substantial net losses in dense metropolitan centers where parking permits, logistics, and labor costs are high. Disaggregate your reporting by market, venue type, retail partner banner, and staffing crew. Analyzing performance at the market level reveals exactly where to reallocate budget to maximize national efficiency.
Distributing full-sized free product samples in neighborhoods where your brand already commands high market penetration often leads to cannibalization.
When an existing loyal buyer receives a free product sample, they frequently delay their next scheduled retail purchase by several days or weeks. Academic research confirms that promotional sampling creates commercial value only when it recruits new category buyers or induces competitive switching. Route your mobile activations into geographic zones and venue profiles with low brand penetration but high category consumption to ensure your team drives market expansion rather than subsidizing existing customers.
Presenting experiential marketing data to senior leadership requires clarity, precision, and business alignment. Chief Marketing Officers and Chief Financial Officers care little about logistical vanity metrics; they demand clear evidence of incremental sales, customer acquisition efficiency, and brand equity growth.
Structure your final campaign reporting into five executive-ready sections:
Deliver a concise overview outlining the core business objective, total campaign expenditure, net incremental revenue generated, and overall campaign Return on Investment. Highlight the primary strategic takeaway and provide a clear recommendation regarding whether to scale, adjust, or discontinue the activation program.
Summarize total physical reach, direct consumer engagements, and verified samples consumed. Present the cost per qualified contact, cost per consumed sample, and labor efficiency metrics across every market visited. Highlight operational variances between venues to guide future tour routing.
Present matched-store scanner data comparisons and difference-in-differences lift percentages. Display velocity curves tracking pre-campaign baselines, activation-week spikes, and post-campaign sales retention over sixty days. Quantify total incremental units sold and isolate net contribution profit generated through retail partner channels.
Detail first-party data capture volumes, customer acquisition costs, and downstream digital engagement rates. Present longitudinal repeat purchase data gathered through loyalty integrations or CRM tracking, demonstrating the ongoing lifetime value of acquired consumer cohorts.
Outline the top-performing geographic markets, optimal venue profiles, and most effective brand ambassador messaging scripts. Identify underperforming markets and operational bottlenecks, providing concrete recommendations for optimizing vehicle routing, inventory management, and retail partner coordination in upcoming campaigns.
Rigorous measurement transforms experiential marketing from an unproven creative expense into a predictable, scalable driver of enterprise growth.

30 Years Experiential & Retail Activation Partner for CPG & Beverage Brands | Multi-Market Demos, Roadshows & Costco/Club Programs That Actually Sell