Robbie Thain
Founder, CEO

Mobile sampling route planning connects daily activation stops with local retail distribution to maximize consumer product trials and generate measurable sales.
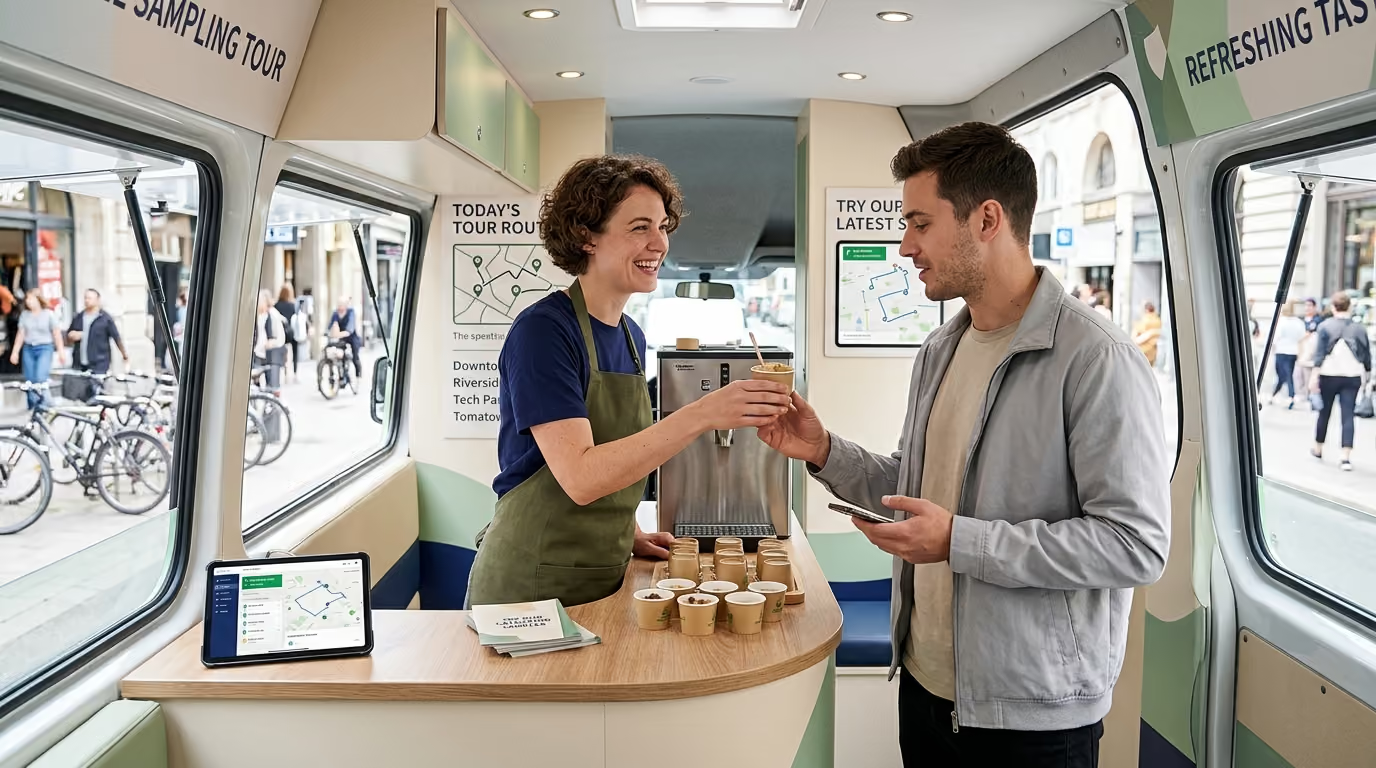
A high-performance mobile sampling route plan is an operating system designed to place brand assets, field teams, and inventory where consumer demand converts directly into retail sales. It is not a generic travel itinerary, nor is it a scenic path connecting random high-traffic ZIP codes across a map. This guide provides a detailed operational methodology for structuring multi-market tours around priority retail accounts, verified audience density, cultural occasions, and measurable commercial conversion.
Field marketing directors often face a chaotic reality on the ground during mobile tours. A branded vehicle arrives at an unverified location only to discover low foot traffic, hostile property security, or strict municipal loading restrictions. Meanwhile, local retail partner shelves three miles away sit fully stocked with inventory that consumers never learn is available. Paid field staff spend more hours sitting in highway gridlock or circling city blocks for oversized parking than putting physical samples into qualified consumer hands.
These operational breakdowns stem from planning routes around vanity metrics rather than commercial fundamentals. When marketing teams prioritize raw attendee projections from third-party event organizers without auditing actual foot traffic flow, activation windows collapse. A food or beverage brand might hand out thousands of units at a music festival, but if those consumers cannot buy the product within their weekly shopping routines, the tour produces immediate waste instead of sustained retail velocity. High-performance field execution requires treating every tour stop as a precision sales mechanism tied directly to channel partners.
A high-performance route plan is an integrated schedule of locations, operating windows, travel legs, staffing allocations, inventory allocations, municipal permits, and retail measurement procedures. It coordinates the logistics of a mobile unit, whether a modified transit van, sampling trailer, or pop-up vehicle, with clear commercial milestones. The goal is to maximize Return on Investment (ROI) by aligning physical product trials with accessible point-of-sale infrastructure.
Every candidate stop within a high-performance routing plan must answer precise operational questions:
Understanding these requirements requires defining the core components of the route architecture.
A mobile sampling tour is a coordinated sequence of temporary physical brand activations executed by a dedicated, traveling field crew. Unlike fixed in-store demonstrations, a mobile unit moves across geographic clusters to meet consumers across diverse life moments. The operational value is not raw mobility. The true value lies in the capacity to shift physical activations dynamically across retail parking lots, lifestyle centers, campuses, and community hubs while maintaining standardized operational discipline.
A priority retailer is a specific store, chain, or regional distributor whose commercial partnership carries strategic value for the brand. Retail priority is determined by distribution agreements, current retail velocity, target account growth goals, shelf placement, and local store manager cooperation. A smaller regional grocer with dedicated endcap displays often serves as a higher-priority routing anchor than a massive retailer that provides zero local promotional support.
A population cluster represents a geographic concentration of consumers matching the target brand profile. The United States Census Bureau provides tools like Census Business Builder to analyze demographic distributions and economic indicators across specific tracts. County Business Patterns data from the Census Bureau can further isolate commercial density, business counts, and local employment hubs.
A cultural moment is a temporal window when priority consumers gather around shared interests, holidays, sports, or seasonal lifestyle shifts. Examples include regional food festivals, endurance races, collegiate move-in weeks, and neighborhood cultural celebrations. A cultural moment yields value only when product relevance, audience mindset, and immediate retail conversion opportunities align.
A conversion opportunity is a functional mechanism that routes a consumer from an initial product trial to a verified commercial transaction. This includes immediate on-site sales, digital coupons redeemable at nearby retailers, scannable QR codes directing to regional store locators, or physical bounce-back offers.
The activation window is the precise timeframe during which the field team actively distributes samples and engages consumers. Planners must separate the activation window from logistical support blocks. Total daily operating time includes transit, vehicle positioning, site leveling, tent setup, cold-chain prep, staff briefings, rest breaks, product restock, teardown, and end-of-day data reconciliation.
Building an effective route begins with multi-layered market mapping rather than drawing lines between major metropolitan areas. Teams must isolate demographic data, physical infrastructure, and retailer distribution networks before selecting specific activation sites.
A common error in route planning is assuming high residential population density translates directly to heavy daytime activation traffic. Route architects must evaluate three distinct population types across target markets:
Overlaying data from Census Business Builder allows planners to identify daytime employment centers that justify midday lunch activations. In our experience managing field activations nationwide, we specialize in creating retail demos, product sampling programs, and roadshows that bring brands face to face with their audiences. Each program is designed to drive trial, build consumer relationships, and accelerate retail velocity across multiple locations. Balancing these distinct populations prevents field teams from deploying outside corporate business parks on weekends or activating residential strip malls during mid-week working hours.
The audience map must be combined with a comprehensive audit of retail distribution. Every candidate market must display active authorized product distribution, verified stock availability, and specific store addresses. Route architects should review County Business Patterns data to determine the commercial density of grocery, specialty, convenience, and mass-merchandise outlets across the trade area.
Activating a mobile sampling unit in a neighborhood with zero nearby retail availability squanders consumer purchase intent. When a consumer enjoys a cold beverage or snack sample, the likelihood of purchase declines rapidly as travel distance to the nearest retailer increases. The physical activation footprint should remain within a tight radius of retail accounts carrying the product.
To prevent subjective decision-making, field marketing directors should evaluate every candidate stop through a structured decision model. A location should not be approved simply because an event organizer promises high attendance or a parking lot space is free.
A standardized scoring framework evaluates candidate stops across commercial, operational, and financial dimensions. Planners can evaluate locations using this weighted formula:
$$\text{Stop Score} = w_a A + w_r R + w_c C + w_o O + w_m M + w_l L$$
Where:
Evaluating locations consistently requires established grading criteria for every operational attribute:
Brands should categorize potential retail stops into four distinct operational tiers to guide route construction:
High-attendance events frequently create operational illusions for experiential marketing teams. A city marathon, music festival, or street fair boasting 50,000 attendees may appear attractive on paper, but massive crowd volume does not automatically yield commercial success.
Large public gatherings function as highly congested traffic systems rather than simple audience pools. Research from the Federal Highway Administration on managing travel for planned special events underscores that site access, parking availability, pedestrian flow, and transit safety require comprehensive advance logistics. Major events often introduce severe operational friction:
The Transportation Research Board outlines that municipal and regional events demand planning lead times scaled to their community impact. Major festivals require up to six months of logistical preparation, while regional events demand three months. Selecting an event stop without evaluating ingress, egress, and local traffic constraints can quickly disrupt an entire weekly tour schedule.
To determine whether an event justifies inclusion over a standard retail activation day, teams can apply an event evaluation model:
$$\text{Event Value} = \frac{\text{Qualified Reach} \times \text{Category Relevance} \times \text{Conversion Access}}{\text{Rights Fees} + \text{Labor Costs} + \text{Travel Logistics} + \text{Operational Risk}}$$
A smaller community athletic competition or local farmers market often outperforms a massive metropolitan music festival under this framework. Lower site fees, relaxed loading logistics, authentic consumer interactions, and proximity to grocery retailers frequently generate higher net Return on Investment. For brands building long-term territory presence, dedicated mobile sampling tour operations ensure that assets are routed to maximize conversions rather than accumulating vanity impressions.
A route plan must reflect the physical realities of moving heavy vehicles, managing product inventory, and supporting human field teams across continuous travel days. Failing to account for operational constraints is the most common cause of tour failure.
Mobile tour planning represents a practical execution of the vehicle routing problem with time windows. The goal is not merely finding the shortest driving mileage between two map pins. The route must ensure the mobile unit arrives during specific operating windows permitted by property owners and municipal authorities.
A field team facing four hours of highway driving, two hours of vehicle maneuvering, and two hours of structural teardown cannot execute an eight-hour consumer sampling activation in a single day. Route planners must track Activation Utilization across the tour schedule:
$$\text{Activation Utilization} = \frac{\text{Consumer-Facing Activation Hours}}{\text{Total Paid Operating Hours}}$$
If total paid staff hours equal twelve, but driving, site delays, and complicated setups reduce public interaction time to four hours, activation utilization sits at an inefficient 33 percent. Route clustering helps protect this ratio.
To eliminate unproductive transit legs, route architects should organize schedules into regional geographic clusters rather than leapfrogging between distant markets. A high-performance regional cluster combines several stop archetypes:
Structuring activations into market-level clusters reduces driver fatigue, lowers fuel expenses, and provides field staff with deep local market knowledge. Teams interested in building scalable operational foundations can review our comprehensive mobile sampling tour guide for structural templates.
Inventory planning is a fundamental routing dependency. Food and beverage sampling programs require stringent temperature management, verified food-safety protocols, and consistent stock replenishment. Route planners must establish clear supply-chain nodes along the tour path:
Sample demand forecasting per stop should follow a standard inventory equation:
$$\text{Required Inventory} = \text{Target Qualified Interactions} \times \text{Expected Acceptance Rate} \times (1 + \text{Safety Buffer})$$
A retail parking lot activation with 1,200 projected qualified passersby and an estimated 60 percent acceptance rate requires 720 samples. Applying a 20 percent safety buffer ($1.20$) sets the required on-board inventory to 864 units. Route plans must schedule visits to regional cold-storage hubs whenever on-board inventory drops near minimum safety thresholds.
Staffing plans must align with physical field labor demands rather than simple headcounts. A common operational bottleneck occurs when a high-traffic stop overwhelms the crew's physical capacity to prepare samples safely.
A high-volume beverage activation may draw thousands of eager consumers, but if the vehicle possesses only two sample pouring stations, adding six promotional greeters will not increase sample throughput. The bottleneck sits at the preparation station. Route plans must calculate output capacity based on equipment limitations, staff rotation schedules, and mandatory rest periods.
Executing a multi-city mobile sampling tour requires translating strategic routing decisions into disciplined field operations. The following phased playbook outlines the chronological workflow from initial concept through daily route optimization.
Depending on brand objectives, tour architects can deploy several proven routing models to balance reach, operational efficiency, and commercial conversion.
Evaluating a mobile sampling tour requires moving beyond top-of-funnel vanity metrics. Counting total pedestrians who walk past a branded vehicle provides no insight into true commercial impact. Field marketing leaders must implement a structured measurement hierarchy that tracks consumer movement from initial trial to repeat purchase.
Academic and empirical retail research confirms that physical product sampling delivers substantial short-term and multi-week sales velocity. In a study published in the Journal of Retailing, researchers Chandukala, Dotson, and Liu analyzed store-level scanner data across multiple product categories. Their findings revealed that in-store product sampling generates immediate sales spikes while creating sustained baseline sales lifts over subsequent weeks. Importantly, their research highlighted that sampling effectiveness varies significantly based on store characteristics, format, and physical display context.
Empirical research from Knowledge Networks and PDI cited by Progressive Grocer demonstrated that product sampling produced a 475 percent sales lift on the day of the activation compared to non-sampled control households. Furthermore, the study tracked consumer purchasing over the following 20 weeks, finding that sampled consumers were 11 percent more likely to repurchase the sampled product. Sampled shoppers were also 6 percent more likely to purchase additional items from the parent brand franchise, proving a measurable brand-halo effect.
Industry reporting from Retail TouchPoints further supported these sustained outcomes. Their data showed an average 74 percent cumulative sales lift for sampled products across a 20-week tracking window. Line-extension products experienced a dramatic 919 percent day-of-event lift and maintained a 107 percent lift over 20 weeks. Additionally, retail studies indicate that placing product sampling demonstrations within 20 feet of the physical merchandise shelf dramatically increases direct sales conversion compared to distant activations.
A balanced scorecard balances operational field efficiency with verifiable financial returns:
For brands structuring financial models, our budgeting and cost optimization framework provides detailed methodologies for calculating exact cost-per-trial benchmarks.
Examining real-world field executions demonstrates how strategic routing frameworks create measurable retail pipeline across competitive food, beverage, and snack categories.
When managing complex multi-brand beverage portfolios, route plans must balance divergent consumer demographics while supporting broad retail distribution. Field marketing teams executing campaigns for brands like Bubly sparkling water and Rockstar Energy structured multi-city routes around high-density lifestyle corridors and grocery channels.
By mapping routes to specific retail accounts, teams activated morning fitness and suburban grocery locations with Bubly, targeting wellness-oriented shoppers near regional supermarket partners. In the afternoon, the mobile unit shifted to convenience-store corridors, action sports venues, and college campuses to distribute cold Rockstar samples to consumers seeking midday energy. This daypart-segmented routing strategy maximized inventory utilization, targeted distinct consumer personas, and drove direct retail sell-through across grocery and convenience channels simultaneously. Detailed analysis of this approach is available in our review on connecting mobile tours to retail pipeline.
A high-growth plant-based snack brand utilized a regional corridor routing model to support its retail expansion into 350 Mid-Atlantic supermarket locations. Rather than booking expensive festival sponsorships, the brand built a 12-week route focused exclusively on Tier 1 and Tier 2 grocery store parking lots.
The tour schedule was built using store-level inventory data. The mobile unit activated only at retail locations with confirmed endcap displays and full shelf inventory. Field brand ambassadors distributed bite-sized samples directly from a custom branded electric vehicle, handing consumers instant $1.00 off coupons valid inside the store.
By activating within 50 feet of the supermarket entrance, the brand achieved an immediate trial-to-purchase conversion rate of 28 percent. Matched store scanner data revealed a 310 percent average daily sales lift at activated stores compared to non-activated control locations in the same market. Over the subsequent 16 weeks, activated stores maintained a 22 percent higher baseline sales velocity, enabling the brand to secure permanent secondary shelf placement from regional category buyers.
Every high-performance route plan requires pre-approved indoor or covered contingency locations. Field teams should monitor weather forecasts 48 hours in advance. When rainfall, extreme heat, or high winds exceed defined safety thresholds, the field manager shifts the activation from an open-air park or street location to an authorized indoor retail demonstration or covered lifestyle center. Tour contracts with private venues should always include flexible rescheduling terms for weather disruptions.
Municipal street-use, parking, health, and fire department permits typically require a minimum lead time of eight to twelve weeks depending on the city. Major metropolitan markets like New York, Chicago, and Los Angeles often require up to 16 weeks for specialized commercial vehicle permits. Private property agreements with retail partners or commercial lifestyle centers generally require four to six weeks of coordination.
Field teams must never direct consumers to an empty store shelf. If a scheduled retail partner suffers an unexpected product out-of-stock, the field manager must immediately implement a contingency rerouting protocol. The team redirects the mobile unit to a secondary Tier 2 or Tier 3 retail location within the same market that has verified on-shelf stock. Alternatively, field staff can pivot the activation to a pure digital engagement model, distributing direct-to-consumer online discount codes until store inventory replenishes.
Refrigerated and frozen food or beverage products require strict adherence to temperature-controlled logistics. Daily route plans must limit driving distances between cold-storage facilities and activation sites to preserve cold-chain integrity. Vehicles must incorporate on-board commercial refrigeration powered by dedicated auxiliary generators or continuous shore power hookups. Furthermore, daily operational schedules must include 30-minute temperature logging windows every morning and evening to maintain regulatory food-safety compliance.

30 Years Experiential & Retail Activation Partner for CPG & Beverage Brands | Multi-Market Demos, Roadshows & Costco/Club Programs That Actually Sell