Robbie Thain
Founder, CEO

Three core conversion stages connect retail product sampling with store topography, targeted loyalty promotions, and digital signage networks to drive sales.
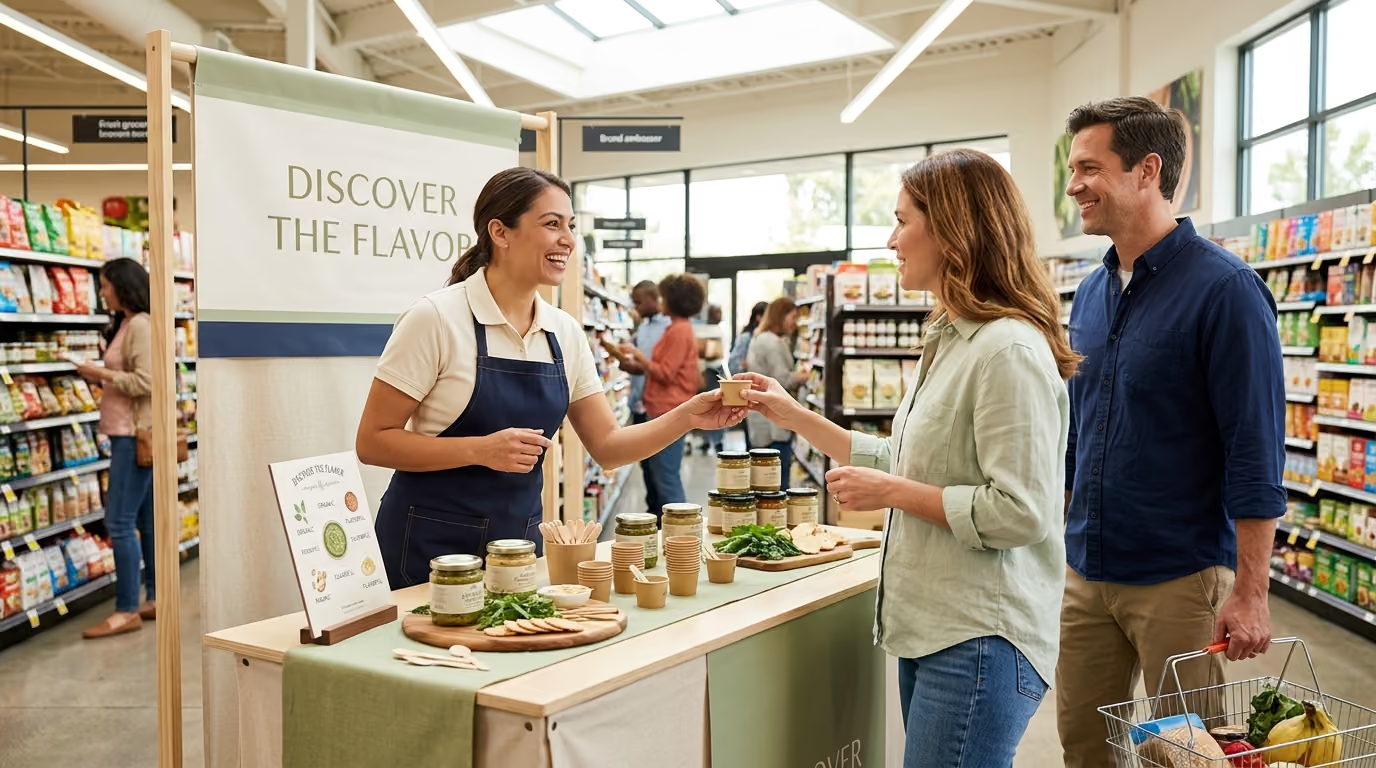
Isolating product sampling as an independent promotional expense is one of the most expensive mistakes a consumer goods brand can make. Integrating live product sampling directly with retail displays, shelf positioning, promotional incentives, and retail media transforms a momentary taste test into a durable sales engine.
Building an integrated in-store activation strategy converts immediate consumer curiosity into verified grocery basket additions and long-term brand equity. This playbook provides retail operators and brand directors with an operational roadmap for aligning physical trial with every conversion lever inside modern retail environments.
Walk into almost any major supermarket on a Saturday afternoon and you will see the same operational failure. A contract demonstrator stands behind a generic folding table positioned in a random open space near the frozen food section. They hand out bite-sized portions of a premium pasta sauce to passing shoppers in disposable cups. When an interested shopper tastes the sauce, likes it, and asks where to buy it, the demonstrator points vaguely toward aisle four. The shopper walks toward aisle four, gets distracted by a promotional endcap for a competitor, finds the home shelf disorganized, and leaves the store without buying.
This disjointed execution wastes marketing dollars. Brands spend substantial capital securing demonstration slots, shipping sample product, and staffing tables, yet fail to build the physical conversion path. When sampling is isolated from inventory staging, point-of-sale communication, and secondary placement, immediate consumer intent evaporates before the shopper reaches the cash register. The brand absorbs the full cost of the sample without capturing the retail transaction.
Field marketing teams often execute sampling programs in complete isolation from retail trade teams. Trade marketing negotiates slotting fees, endcap displays, and circular features with retail buyers. Field marketing hires third-party agencies to distribute samples. When these two efforts run on separate calendars without coordination, the brand loses the compounding sales momentum that occurs when physical trial meets immediate product availability.
To fix this operational disconnect, brands must stop viewing sampling as brand awareness theater. Product sampling is the sensory ignition point of a broader shopper conversion sequence. Every tasting station, demonstration cart, and product interaction must connect directly to an organized path to purchase on the retail floor.
Designing a high-converting in-store program requires understanding the distinct functional role of each retail touchpoint. Academic research published in the Journal of Retailing demonstrates that in-store sampling produces both an immediate sales lift and sustained long-term volume increases. Furthermore, the data proves that repeated sampling of the same item creates a multiplicative sales effect over time, whereas single isolated events quickly dissipate.
Sampling does something that static shelf placement cannot: it removes consumer hesitation by providing immediate sensory and functional proof. When shoppers experience a product firsthand, their perceived purchase risk drops significantly. Research from food sampling trials indicates that live interactions induce trial across diverse demographic groups, encouraging shoppers with no prior category purchase intent to buy.
However, sensory proof alone does not complete the commercial transaction. Secondary placement, shelf positioning, pricing incentives, and retail media must work in tandem to guide the shopper from trial to checkout.
Secondary displays such as endcaps act primarily as visual beacons and traffic capture mechanisms. Research analyzing supermarket endcaps shows that products placed on secondary endcap displays are seen by nearly twice as many shoppers as products located exclusively within interior aisles. An item placed on an endcap can achieve a 60 percent sales increase without any price reduction.
While endcaps draw the eye and capture passing foot traffic, the primary shelf remains the ultimate anchor for brand choice. Research from retail display studies reveals that front endcaps generate substantial category-level interest, but in-aisle shelf displays have the strongest direct influence over final brand selection. If your sampling station directs shoppers to a messy, out-of-stock home shelf, conversion collapses.
A well-structured sampling campaign does more than switch shoppers from a competitor to your product. Research in the Journal of Retailing confirms that sampling creates a true category-expansion effect rather than simple brand substitution. Live sampling introduces new consumers to the category, lifting overall category sales volume while benefiting retail partners.
Presenting sampling as a category-growth driver changes retail buyer conversations. When negotiating with category managers, presenting a coordinated plan that combines live trial with modern product sampling playbooks shifts your activation from an intrusive operational request into a valuable category-development asset.
Visual prominence produces sales only when placed in a logical retail context. Research examining display environments shows that displays situated in incongruent store sections attract visual attention but generate fewer completed purchases. Placing a premium refrigerated dip display in the dry cereal aisle might turn heads, but shoppers rarely buy because the physical context clashes with their immediate shopping mission.
Every element of your sampling activation must reinforce spatial and thematic congruence. The sample station, secondary display, and primary shelf must align with the shopper's natural basket-building path.
Navigating the geography of a retail store dictates whether your sampling event succeeds or fails. Store layout determines traffic speed, shopper attention, and visual reach.
Field studies analyzing supermarket endcaps reveal critical differences between front-of-store and rear-of-store placements. Academic analysis by retail researchers indicates that rear endcaps generate an average brand sales increase of 416 percent, compared to 346 percent for front endcaps. Additional tracking studies confirm that rear endcaps receive 24 percent more foot traffic and 30 percent greater visual reach than front-of-store displays.
Front endcaps excel at capturing fast impulse sales as shoppers enter the store. However, shoppers near the front entrance often move at higher speeds with specific basket goals in mind. Rear endcaps, situated along perimeter corridors where shoppers decelerate near dairy, meat, and fresh bakery sections, provide higher dwell time. Locating your live sampling stations within sightlines of rear endcaps captures shoppers when they are receptive to product discovery.
Our team structures in-store activations using a triangulated physical layout that connects the sample table, secondary display, and primary shelf into an intuitive loop.
Connecting these three points ensures the consumer encounters multiple opportunities to put your product into their cart. To refine this spatial approach across formats, review our tactical guide on matching retail sampling locations with shopper intent.
Product sampling removes sensory hesitation, but price friction can still block the final purchase decision. Deploying promotional incentives at the moment of trial creates a financial bridge that accelerates conversion.
Research examining sampling and couponing interactions indicates that treatments combining physical product samples with discount coupons achieve higher purchase rates than sampling alone. Furthermore, cashback and instant-redemption coupons act as strong conversion triggers for non-category buyers who require an extra incentive to complete trial.
Do not distribute paper coupons blindly. Brand ambassadors should hand coupons directly to shoppers who express positive verbal feedback during the tasting interaction. Handing a coupon directly to an engaged shopper creates an implicit social exchange that increases the likelihood of immediate basket placement.
Modern retail environments allow brands to connect physical trial with digital loyalty systems. Research from European retail studies comparing digital loyalty rewards with targeted coupons found that both mechanisms significantly lift purchase frequency and basket spend. A single redemption of loyalty points generated higher immediate basket expenditures, while targeted coupons drove three times greater overall expenditure when measured across recurring purchase cycles.
Integrating digital loyalty offers with live sampling bridges physical execution with retail data systems. Shoppers can scan a QR code at the sampling station to clip a digital coupon directly into their retailer loyalty app. This verifies the physical trial while capturing first-party shopper data that trade teams use to track post-event repeat purchasing.
Supermarket display studies reveal that combining endcap displays with price promotions yields a 313 percent average increase in unit sales compared to aisle-only promotions. However, deep discounts are not always necessary when the product sample provides clear taste superiority.
Use modest price incentives designed to encourage multi-pack or multi-flavor purchases rather than severe single-unit discounting. A small discount on a multi-buy offer increases trial across multiple stock-keeping units without degrading brand value.
Retail Media Networks represent one of the fastest-growing budget categories in modern marketing. However, digital retail media often operates completely disconnected from physical store operations. Integrating digital media with live floor execution creates an air-cover dynamic that reinforces sampling.
Field-experimental data examining 237 retail advertising campaigns across 30 million shoppers demonstrates that in-store digital signage increases featured product purchases by 8.1 percent. The research confirms that sales lift is significantly higher when digital screens are positioned in direct physical proximity to the advertised product. The sales impact of digital displays peaks during high-traffic weekend hours, later in the day, and when displaying clear emotional or value-driven messaging.
Running digital media on screens located near your live sampling station preconditions passing shoppers. When a consumer sees a high-definition product video on an overhead screen moments before encountering your brand ambassador, brand recognition increases. This prior exposure makes the shopper far more receptive to accepting a physical sample. To explore this operational connection further, study our analysis on how first-party shopper data optimizes in-store engagement.
Leading grocery chains allow brands to geo-fence store locations and trigger digital app notifications when loyalty members enter the store. Timing mobile app banners and digital circular features to coincide exactly with weekend sampling dates creates coordinated touchpoints.
A shopper opens their grocery app to check their shopping list, sees a featured banner highlighting your product, walks past your rear endcap, tastes the product at your demonstration station, and redeems the digital coupon at checkout. Synchronizing digital retail media with live floor execution turns fragmented marketing channels into a unified sales sequence.
Flawless execution requires disciplined standard operating procedures. The following step-by-step playbook outlines the operational sequence necessary to conduct an integrated retail activation.
For teams expanding these operations across large geographic territories, our in-store product sampling execution playbook offers advanced systems for multi-unit store rollouts.
Measuring the success of an integrated retail program requires looking beyond the number of sample cups handed out. Marketing operators must track clear lead and lag indicators to calculate accurate Return on Investment and justify trade marketing budgets.
Lead metrics track field performance and shopper response during the live event. Measuring these operational signals allows field managers to adjust staff scripts, station positioning, and replenishment frequency in real time.
Lag metrics evaluate financial outcomes, sales lift, and trade performance using scanner data and retail portal analytics. These figures determine the true profitability and commercial viability of the retail campaign.
Evaluating these metrics across store clusters reveals performance trends. Brands should segment performance based on store size, regional demographics, and display placement to continuously refine their retail marketing investments.
Understanding how these integrated mechanisms function in live retail environments requires examining operational execution across established grocery networks.
When introducing a new refrigerated culinary line into regional supermarket divisions, our team built an execution plan combining high-dwell physical sampling, rear endcap displays, and digital loyalty incentives. We aligned the demonstration calendar with a temporary price reduction negotiated by the brand's sales team. Sampling carts were positioned in the rear deli perimeter within direct sight of a dedicated endcap display stocked with three primary flavor varieties.
A VP of Marketing reflected on our partnership: 'Robbie, it was a pleasure working with you and your team. You turned our launch into an experience that connected with shoppers and built lasting excitement for our brand. We're already looking forward to the next project together.' Our team created a launch experience that resonated with retail shoppers and generated momentum for future collaborations.
The activation yielded a 340 percent lift in same-day sales velocity across activated doors compared to non-activated control stores. More importantly, 38 percent of the total brand volume sold during the event was purchased directly from the home aisle, capturing sales for premium line extensions that were not featured at the sampling table. The combination of live trial, visible secondary placement, and smooth navigation to the home shelf produced sustained retail sell-through that persisted months after the campaign ended. To understand how live activations connect directly with broader experiential brand architecture, review our analysis on connecting experiential marketing to shopper strategy.
Even experienced brand managers encounter operational friction when executing multi-touchpoint programs. Avoiding these common mistakes preserves trade margins and protects field efficiency.
The most common execution mistake is placing a demonstration cart in an open store area with no physical or visual connection to product inventory. When shoppers cannot immediately see where to grab a box, purchase intent plummets. Never allow store staff or event teams to set up an isolated table without establishing a dedicated inventory stack or secondary display within arm's reach.
Slashing prices aggressively during a sampling event often attracts price-sensitive bargain hunters who buy once and never return at full price. The sample itself should serve as the primary conversion hook by proving product superiority. Use modest promotional incentives designed to reward multi-item purchases rather than deep discounts that erode gross margins.
Treating sampling as a one-time event severely limits long-term commercial impact. The academic literature confirms that repeated sampling waves compound baseline sales growth over extended periods. Schedule multi-event flights across quarterly retail calendars to reinforce brand habits and capture repeat shoppers.
Shopper demographics and purchasing habits vary widely across individual store locations within the same retail chain. Research on supermarket promotions reveals that promotional sensitivity and placement responsiveness differ across shopper segments. For example, stores with high participation in government nutrition programs show elevated sensitivity to display promotions. Tailor your promotional incentives, packaging sizes, and field messaging to match the specific shopper profile of each store location.
Executing a disciplined, multi-touchpoint sampling program transforms casual retail foot traffic into sustained grocery volume and measurable commercial growth.

30 Years Experiential & Retail Activation Partner for CPG & Beverage Brands | Multi-Market Demos, Roadshows & Costco/Club Programs That Actually Sell