Robbie Thain
Founder, CEO

Maximized retail velocity and measurable incremental lift result from auditing store selection, execution quality, engagement funnels.

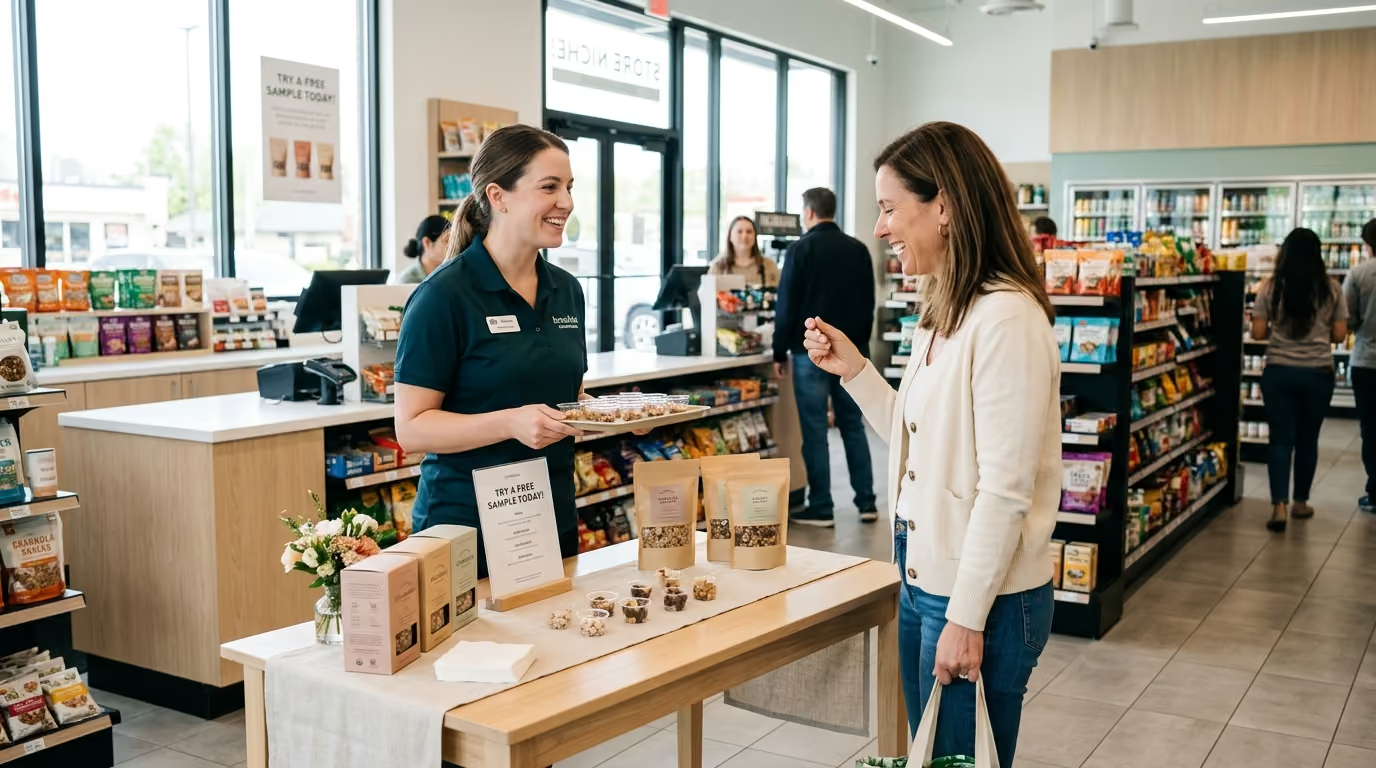
Most brand managers celebrate a retail sampling event because hundreds of paper cups were handed out. Distributing inventory is an expense, while building sustainable retail velocity is an operational discipline that requires systematic auditing across the entire retail path to purchase.
A brand director walks into a high-volume supermarket on a busy Saturday afternoon. The sampling cart is surrounded by shoppers, the ambassador is smiling, and napkins are flying into trash bins at record speed. On Monday morning, point-of-sale data reveals that weekly SKU velocity barely moved.
When a campaign underperforms, marketing teams routinely blame the field staff or assume the product failed the taste test. The reality is that commercial failure can happen at any link in the execution chain. A broken program is rarely broken everywhere. It usually suffers from one fatal bottleneck that went unmeasured.
To identify why an activation failed, field operators must evaluate the commercial response using a diagnostic model:
Commercial outcome = qualified traffic × engagement rate × trial rate × purchase conversion × repeat rate × realized margin − program cost
This equation is an operational diagnostic tool. It forces marketing leaders to isolate distinct failure modes instead of viewing performance as a single vanity metric. A weak revenue result might stem from poor shelf placement rather than lack of shopper interest. Strong engagement paired with zero purchases points toward an uncompetitive price point or an out-of-stock shelf.
To audit an underperforming campaign effectively, evaluate five distinct operational layers:
Verify whether in-store sampling was the correct mechanism for the product format and business objective. Highly complex products requiring extensive consumer education often struggle in high-speed grocery environments.
Examine whether the campaign selected the right retail banners, specific store locations, target shopper demographics, and activation dayparts.
Review whether field ambassadors delivered the brand message accurately, maintained food safety standards, and actively directed shoppers to the shelf.
Measure whether consumer trial translated into immediate register scans, basket attachment, and sustained velocity weeks after the activation.
Confirm that reported sales lift represents true incremental volume rather than baseline demand, seasonal traffic spikes, or sales shifted from sibling product lines.
Academic research by Chandukala, Dotson, and Liu published in the Journal of Retailing confirms that in-store sampling produces both immediate and sustained sales effects across retail scanner datasets. Their research demonstrates that specific store characteristics heavily moderate these outcomes. Furthermore, repeated sampling events generate a compounding effect on long-term brand performance. If your audit only counts distributed samples, you are ignoring the causal variables that drive actual commercial returns.
Store selection is a causal driver of campaign performance, not a routine scheduling detail. Selecting the wrong retail locations guarantees poor performance regardless of product quality or ambassador enthusiasm.
Large, high-volume retail locations often look attractive on paper. High foot traffic does not automatically equal qualified shopper traffic. In massive retail formats, shoppers are frequently rushed, managing large families, or focused on specific shopping lists. In contrast, smaller footprint stores or specialty grocers may generate higher conversion rates because shoppers have more dwell time and higher category interest.
When auditing store selection criteria, evaluate the following baseline variables:
A rigorous audit must identify common store selection failure patterns that corrupt campaign data:
This pattern indicates that foot traffic was not aligned with the product category. Shoppers may have been on quick grab-and-go missions. Alternatively, the activation was positioned in a congested entryway far removed from the product aisle.
Small baseline numbers generate unstable percentage increases. A store selling two units a week that suddenly sells eight units shows a 300 percent lift. This small volume does not cover activation labor costs and distorts aggregate reporting.
Agencies often select top-tier stores to demonstrate strong volume. Without comparing these stores against matched control locations with parallel sales trajectories, you cannot distinguish organic store momentum from marketing impact.
Selecting the right retail footprint requires matching retail sampling locations with shopper intent across different store formats. A location with lower gross traffic but aligned category shoppers consistently outperforms a high-traffic location filled with distracted consumers.
A successful retail sampling audit treats the sampling station as a physical conversion funnel. You cannot manage what you do not measure step by step. Collapsing on-site interactions into a single total number of samples distributed obscures exactly where consumer drop-off occurs.
To run a diagnostic audit, track these specific stage counts during every four-hour shift:
The total count of adult shoppers passing through the activation zone who match the target consumer profile.
The number of passing shoppers whom the brand ambassador actively greeted and invited to the station.
The number of consumers who paused their shopping trip to listen to the pitch or examine the display.
The number of qualified consumers who received, tasted, or applied the product sample.
The count of engaged consumers who accepted an instant redeemable coupon, recipe card, or promotional voucher.
The observed number of consumers who physically picked up a retail package and placed it into their shopping cart.
Calculate the performance ratios across each step to pinpoint operational weaknesses:
Approach Rate = Shoppers Approached / Qualified Passersby
Stop Rate = Shoppers Stopped / Shoppers Approached
Trial Rate = Samples Distributed / Shoppers Stopped
Immediate Conversion Rate = Immediate Cart Placements / Samples Distributed
Units Per Purchaser = Total Units Sold to Attributable Buyers / Total Attributable Buyers
These funnel calculations reveal the underlying issue immediately. A low approach rate points to poor station placement, bad sightlines, or passive staff who stay behind the table. A high approach rate paired with a low trial rate indicates an unappealing presentation, hygiene concerns, or an ineffective verbal invitation.
When trial rates are high but immediate cart placements stall, the product succeeded sensory validation, but failed commercial validation. The barrier is price, pack size, shelf distance, or lack of an immediate incentive.
Field managers should combine these metrics with structured approaches for high converting retail demo sampling strategies to ensure ambassadors actively manage each conversion step.
The most frustrating failure in retail sampling occurs when field staff create high consumer purchase intent, but the retail store cannot fulfill the demand. Sampling creates an immediate handoff challenge. A consumer must walk from the demonstration cart to the shelf and find the exact product they just tasted.
Every performance audit must assess these physical readiness gates:
Confirm that the specific sampled SKU is officially authorized and active in the store inventory system. Ambassadors frequently sample line extensions or new flavors that the store has not yet placed on shelves.
Check whether the shelf was fully stocked before the event began. If a shelf holds only six units of inventory, the station will sell out within the first thirty minutes, leaving subsequent shoppers unable to buy.
Audit the price tag on the shelf. If the promotional discount agreed upon with the retail buyer is not activated in the point-of-sale system, consumers will abandon the product at checkout.
Measure the physical distance between the sampling cart and the home shelf. If the station is set up three aisles away, ambassadors must physically hand packages to shoppers or provide clear directional guidance.
Ensure that additional cases are staged in the back room and accessible to store staff for mid-shift restocking.
When a store runs out of stock mid-shift, that location must be classified as commercially blocked. Do not mark it as a staff or product failure. Measuring consumer conversion rates in an out-of-stock environment distorts your broader campaign analysis.
For perishable food and beverage campaigns, safety standards are non-negotiable operational gates. Food safety protocols require strict temperature control, such as keeping hot items above 60 degrees Celsius and chilled items below 4 degrees Celsius. The audit must confirm that ambassadors use digital thermometers, clean preparation surfaces, and fresh gloves. An unhygienic station destroys brand trust instantly.
Brand ambassadors represent the critical human touchpoint between your product and the retail shopper. A poorly trained, disengaged, or passive ambassador will depress conversion rates across an entire market, masking the true commercial viability of the product.
In our experience, we design mobile activations and roadshows that accelerate consumer trial, build trust, and boost retail velocity during 90-day product launch windows. Our structured approach transforms initial product trial into sustained consumer confidence and retail performance. Achieving that standard requires rigorous operational oversight rather than assuming field teams will execute intuitively.
To audit live execution performance systematically, follow this step-by-step field verification playbook:
Ambassadors must complete a digital check-in thirty minutes before the shift begins. They must submit timestamped and geotagged photos showing:
Audit whether staff are using an active engagement posture. Ambassadors should stand in front of or beside the cart rather than hiding behind it. The opening dialogue must follow a three-part structure:
Ambassadors must verify shelf inventory levels at the top of every hour. If shelf stock drops below four units, the ambassador must notify store personnel or pull authorized back-stock immediately.
Field staff must record estimated passersby, completed samples, coupons distributed, and observed conversions in sixty-minute increments. Hourly tracking prevents end-of-shift data fabrication and highlights peak traffic performance windows.
Field managers should conduct random, unannounced audits across a minimum of 15 percent of activated locations. Supervisors use standardized scorecards to grade staff on product knowledge, hygiene, objection handling, and active selling behaviors.
Before packing down the station, the ambassador must meet with the store manager on duty. The manager inspects the area for cleanliness, reviews total units moved, and provides a formal signature confirming completion.
Maintaining operational consistency across hundreds of retail locations requires a structured field operations framework for retail events that leaves nothing to chance.
Evaluating a sampling campaign purely on gross sales during the event day is misleading. A massive sales spike does not prove the activation generated incremental revenue. Sales might have increased due to an existing temporary price reduction, seasonal holiday traffic, competitor supply shortages, or heavy retailer circular advertising.
To establish true incrementality, your audit must establish a clean counterfactual. The counterfactual answers a simple question: What volume would these specific stores have sold if no sampling event took place?
The gold standard for retail activation measurement is a difference-in-differences design using matched control stores:
Incremental Lift = (Treatment Post − Treatment Pre) − (Control Post − Control Pre)
In this calculation, the treatment group consists of the stores hosting sampling events. The control group consists of carefully matched stores within the same retail banner, geographic market, and volume tier that received no sampling support. Both groups must demonstrate parallel sales trends during the four-week pre-campaign period.
When auditing sales impact, separate commercial volume into four distinct layers:
The specific unit and dollar increase generated by the exact product item featured at the sampling table.
The sales increase observed across sibling products, different flavors, or adjacent pack sizes under the same brand umbrella.
The net growth of the entire retail product category within the store. Research from the University of Wisconsin School of Business highlights that effective sampling introduces new consumers to the category, expanding total department volume rather than simply reshuffling existing brand loyalists.
Determine whether the sales spike for the sampled SKU caused an equal drop in sales for your other product lines. Furthermore, track post-event sales for two to four weeks. If sales plummet below baseline immediately after the campaign, consumers merely stockpiled discounted inventory, known as pantry loading.
Industry benchmarks provide useful reference points when analyzing commercial performance. A widely cited study by Knowledge Networks and PDI reported an average 475 percent sales lift on the day of sampling events, with an 11 percent increase in repeat purchases over a 20-week follow-up window. Similarly, campaign data from Walmart Connect Canada showed average event-day sales increases of 470 percent, alongside a 284 percent lift in new-to-brand customers and a 13 percent sustained lift three months post-campaign.
These benchmarks must be interpreted with caution. Launching an entirely new food concept generates different percentage dynamics than defending market share for an established brand. Teams must consistently refine retail demo and sampling strategies to prove Return on Investment in-store by isolating clean incremental volume from normal demand baselines.
A complete performance audit balances operational leading indicators with financial lagging metrics. Evaluating only lagging financial data prevents field teams from correcting issues mid-campaign. Conversely, relying only on leading operational metrics leaves senior leadership without evidence of financial Return on Investment (ROI).
Establish clear boundaries for both metric categories across every retail market:
To conduct a structured evaluation, implement an audit scorecard that establishes clear operational gates:
If a retail store fails Gate 1 or Gate 2, the audit team must halt soft metric calculations. Do not average high consumer engagement scores into a store that suffered a complete out-of-stock failure. Document the specific operational breakdown, fix retail distribution, and reschedule the activation.
Tracking these critical numbers establishes the standard metrics needed to prove retail sampling Return on Investment to retail buyers and executive stakeholders.
When field audits reveal weak performance, marketing directors must diagnose the underlying root cause rapidly. Below are seven recurring operational failure patterns observed in high-volume retail activations, along with the precise corrective actions required.
Shoppers are streaming past the demonstration station, but fewer than ten percent stop to interact.
Shoppers stop and listen to the ambassador, but politely decline to taste or test the sample.
Shoppers enthusiastically taste the product, express positive feedback, and walk away without purchasing a retail unit.
The activation hits record single-day sales, but velocity immediately drops back to flat baselines the following week.
The featured product shows moderate sales gains, but total sales across the entire competitor category increase significantly.
The campaign moved thousands of units, but post-campaign accounting reveals negative net Return on Investment.
Ten stores in a market generate remarkable sales lift, while fifteen identical stores within the same retail banner show flat results.
Systematic performance auditing turns physical product sampling from an unpredictable field expense into a repeatable, high-converting retail growth engine.

30 Years Experiential & Retail Activation Partner for CPG & Beverage Brands | Multi-Market Demos, Roadshows & Costco/Club Programs That Actually Sell