Robbie Thain
Founder, CEO

Field marketing teams facing rising vehicle costs and paid downtime can streamline mobile sampling tours by optimizing labor, transit, and staging.
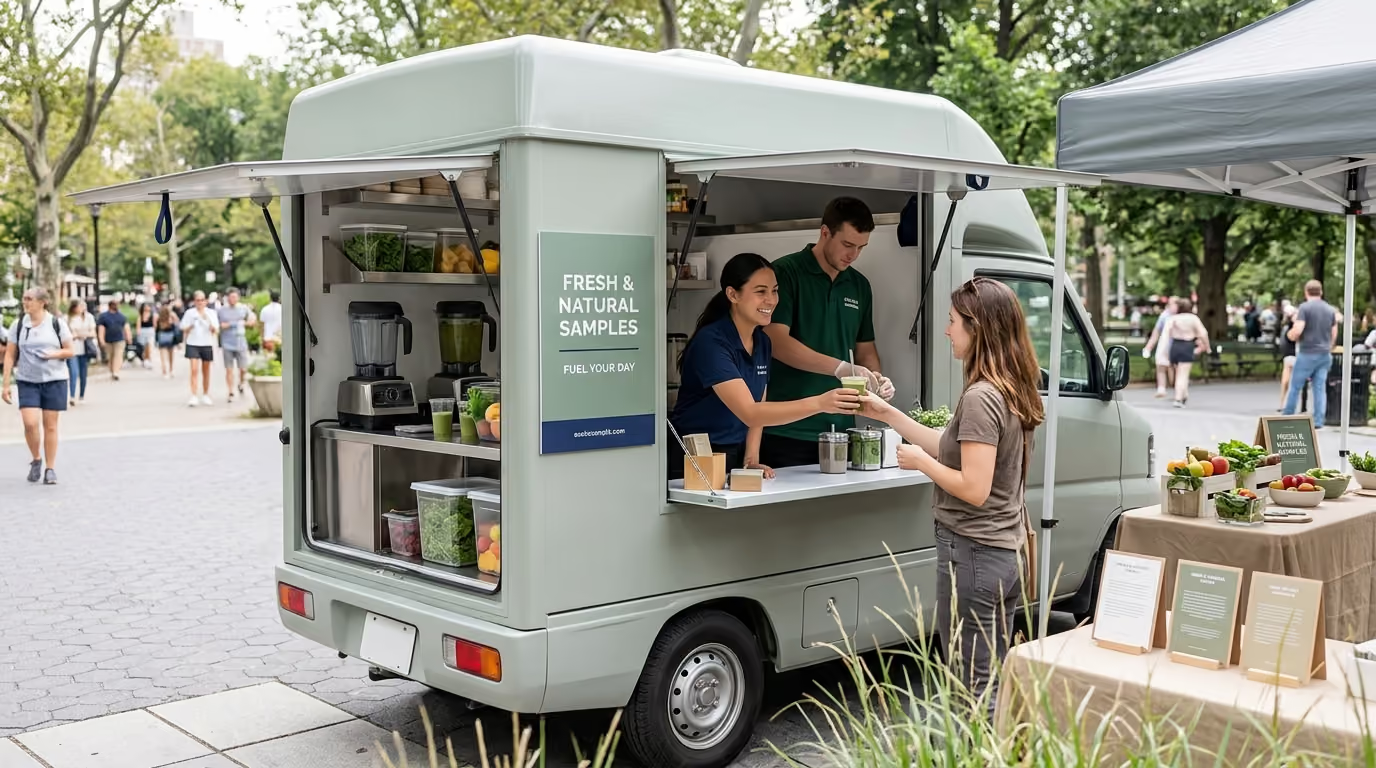
How to control mobile sampling tour costs without sacrificing consumer experience or sample volume is a problem every field marketer searches for when budgets tighten. This guide provides a systematic operating framework to eliminate paid downtime, optimize vehicle economics, tighten route density, and protect data integrity across multi-city activations.
Managing a mobile sampling tour requires balancing direct field expenditures against tangible commercial outcomes. Operating an efficient tour means systematically identifying hidden operational friction across labor, vehicles, routes, storage, and inventory to generate maximum Return on Investment (ROI) for every dollar spent.
The trade show floor and the mobile event footprint share a familiar chaotic reality. A branded van pulls onto a festival plaza forty minutes behind schedule because of unmapped loading dock restrictions. Two brand ambassadors stand idle while waiting for an external generator technician, accumulating paid nonproductive hours. Half a pallet of chilled beverage cans sits in ambient heat while the footprint lead scrambles to locate an access badge. When the activation finally opens, staff rush through interactions to hit raw volume quotas, skipping consumer surveys and failing to record discarded cans. At the end of the weekend, the brand has spent thousands of dollars on overtime and transit, yet leadership receives only vague footfall estimates and a massive bill for unaccounted product.
Building an operationally disciplined mobile tour requires moving away from guesswork and managing your activation footprint with industrial precision.
Field marketing budgets often suffer from poor categorization. When vehicle rental, ambassador staffing, venue fees, and product delivery are blended into aggregate line items, cost leakage becomes invisible. Operators must separate baseline fixed commitments from variable market costs to understand where margins erode.
A complete tour budget architecture isolates direct vehicle expenses, specialized setup labor, brand ambassadors, transport logistics, permits, cold-chain storage, data infrastructure, and contingencies. Grouping these expenses into isolated categories exposes cost drivers that typically go unnoticed.
Transportation is far more than a monthly lease rate. It encompasses fuel consumption, toll road transponders, trailer repositioning, and local courier runs for emergency stock. Storage must account for regional warehousing, cross-dock transfer fees, short-term cold storage, and site staging. When brands evaluate proposals purely on vehicle rental rates, they misjudge the true expense of running a mobile footprint.
To maintain financial control, operations teams should calculate the landed daily cost for every market before signing venue agreements. This calculation requires adding all anticipated travel hours, local staging requirements, and venue access fees to baseline vehicle overhead.
Evaluating these line items independently allows brand managers to identify whether a tour is inefficient because of high asset costs, poor routing, or bloated on-site labor.
Staffing represents one of the largest controllable operational expenses in experiential marketing. Blending all on-site personnel into a single general labor line item obscures productivity losses. A cost-effective staffing model separates field workers into specialized pools based on their primary operational function.
The Event Marketer Experiential Marketing Cost Benchmarking Report provides clear visibility into market labor baselines across distinct experience tiers. Highly experienced brand ambassadors average $53.14 per hour, medium-experience ambassadors average $39.98 per hour, and low-experience ambassadors average $26.07 per hour. General event staff average $28.36 per hour, while dedicated setup and teardown labor commands an average rate of $54.23 per hour.
These figures illustrate why using one blended hourly rate creates false assumptions. Deploying premium brand ambassadors at $53.14 per hour to unload heavy staging crates wastes budget on overqualified labor for physical handling. Conversely, hiring low-tier general staffers at $26.07 per hour to conduct technical product demonstrations often degrades consumer engagement and lowers survey capture rates.
Cost control does not mean defaulting to the cheapest labor tier. Inexperienced staff can lead to lower compliance, slower sample throughput, and dropped survey capture. The strategic objective is matching the correct wage tier to the operational task.
To track labor efficiency accurately, field operations should separate paid hours into four distinct categories:
This metric captures all hours billed for an event day, from morning call time to final evening sign-off. It establishes the baseline cost of maintaining a field team on site.
Transit time represents nonproductive labor spend where staff are moving between markets rather than engaging consumers. Long cross-country jumps quickly drain payroll budgets through driving stipends and hourly travel pay.
Physical footprint assembly and repacking require specific mechanical discipline. Tracking these hours separately prevents logistics delays from bleeding into public engagement windows.
This is the only labor window that generates direct commercial value. It measures the precise time ambassadors spend interacting with consumers, distributing product, and capturing zero-party data.
Evaluating staffing productivity requires moving past aggregate labor expense. Teams must calculate cost per qualified interaction, cost per completed survey, and cost per distributed sample.
If an activation runs four hours with a six-person crew costing $1,200 in labor, and yields 300 deep consumer conversations, the cost per qualified interaction is $4.00. If cutting two ambassadors reduces labor to $800 but drops interactions to 100 because of long lines, the cost per qualified interaction rises to $8.00. Cutting headcount can paradoxically double the acquisition cost.
For advanced field programs, reducing operational friction across multi-city tours requires testing staffing models under live conditions. Field managers should vary crew sizes across comparable footprints while keeping the sampling script identical. If a four-person crew delivers 90 percent of the volume and survey completions of a six-person crew, the footprint can scale down safely. If wait times increase and survey completion rates fall below the acceptable baseline, the labor reduction is a false economy.
Branded sampling trucks, custom trailers, and mobile display vans are visible centerpieces of experiential tours, but their utilization is frequently miscalculated. Evaluating a vehicle based solely on its monthly lease or rental quote hides significant nonproductive capital burn.
Vehicles incur costs every calendar day, regardless of whether they are interacting with consumers or parked in a secure lot. To determine real asset efficiency, teams must model vehicle logistics as an integrated system.
Once total vehicle overhead is established, divide it by productive activation hours rather than total calendar days.
Consider a custom beverage van that costs $18,000 per month across lease, wrap amortisation, commercial insurance, preventative maintenance, and storage. If the vehicle operates on a dense schedule completing 20 activations per month at six hours per activation, it delivers 120 productive hours. The vehicle cost is $150.00 per productive hour.
If poor route planning, long transit legs, and permit delays reduce the schedule to six activations per month at four hours each, the vehicle delivers only 24 productive hours. The vehicle cost spikes to $750.00 per productive hour. The lease price remained unchanged, but operational inefficiency quintupled the hourly capital cost.
Achieving high vehicle utilization requires tracking operational time buckets across the fleet. Every hour on the calendar falls into one of three operating states:
The vehicle is deployed on site, systems are powered, signage is positioned, and brand ambassadors are actively distributing samples to foot traffic.
The vehicle is in transit along an optimized route, undergoing scheduled maintenance, or positioning on site within scheduled venue access windows.
The vehicle is sitting in paid storage between distant markets, stalled at a venue waiting for access credentials, or sidelined by preventable mechanical failures.
Cost-conscious operators design tour schedules to maximize active production hours while minimizing idle nonproductive time. Deploying specialized mobile sampling tours that deliver your brand directly to consumers requires constant monitoring of these operating ratios. A vehicle sitting parked outside a depot generates zero consumer impressions while accumulating fixed depreciation and insurance overhead.
Setup and teardown operations represent major hidden labor costs. The Event Marketer benchmarking data indicates that general event labor for setup and teardown averages $54.23 per hour. When footprint construction is disorganized, specialized crews sit idle or work into expensive overtime tiers.
Reducing site setup costs requires standardizing procedures from the moment wheels stop on site until the first sample is handed to a consumer. Measuring setup time solely as the physical unloading of boxes obscures bottlenecks in power configuration, refrigeration stabilization, and data system connectivity.
A systematic time study evaluates setup across nine distinct operational milestones:
Documenting each phase helps operations managers identify recurring delays. If refrigeration stabilization consistently takes 90 minutes because staff forget to pre-chill cooling units, the team can implement onboard pre-cooling protocols during the drive.
Standardizing teardown is equally vital. When activations end, staff fatigue often leads to careless packing, damaged display assets, and lost components. Damaged structural assets require costly rush repairs or expedited replacements before the next city stop.
Implementing standardized packing schematics inside the vehicle ensures every display piece, power cable, and POS banner has a dedicated, secure position. A disciplined teardown checklist reduces outbound labor hours and protects tour infrastructure over multi-month schedules.
The highest-value cost-control opportunities in experiential marketing sit hidden in unmonitored downtime. Looking only at total payroll totals fails to show why labor costs exceeded forecasts.
To isolate waste, management must categorize all paid labor hours across nine operational classifications:
Active, face-to-face time spent introducing products, delivering brand talking points, distributing samples, and answering consumer inquiries.
Pre-activation tasks including slicing, heating, chilling, portioning, unboxing merchandise, and setting up staging tables.
Mid-event inventory restocking, transferring stock from onboard storage to active demo bars, and managing trash or recycling bins.
Logging consumer survey responses, troubleshooting scanning hardware, running daily data syncs, and documenting interaction counts.
Paid driving time, crew shuttle transit between hotels and venues, and vehicle repositioning across tour stops.
Idle crew time caused by delayed venue access, missing delivery shipments, late site contacts, or power grid failures.
Department of Transportation mandated driver rest breaks, scheduled crew lunch periods, and compliance recovery intervals.
Morning crew check-ins, safety audits, daily vehicle walk-around inspections, and digital timesheet submissions.
Time spent repairing improperly assembled displays, retrieving forgotten assets, repacking damaged product, or resolving technical faults.
Classifying field hours into these specific buckets allows leadership to diagnose operational issues quickly. If waiting time accounts for 15 percent of total payroll, the issue is not hourly wages; it is poor venue logistics and unconfirmed access schedules. If rework hours are high, the onboarding curriculum must be redesigned to emphasize proper equipment handling.
Academic vehicle routing research shows that transit optimization is fundamentally a time-window problem rather than a simple distance-minimization exercise. Deterministic routing algorithms that focus solely on shortest driving mileage frequently fail in live environments due to traffic variability, venue loading restrictions, and strict municipal parking windows.
A mobile tour route involves strict operational constraints that must be modeled simultaneously:
Optimizing a route requires calculating total transition cost rather than looking exclusively at highway miles.
A geographic path that saves 50 miles by taking secondary roads may introduce severe traffic delays, pushing arrival past a venue's strict two-hour load-in window. Missing that window can result in forfeited site access, complete cancellation of an activation day, and thousands of dollars in lost value.
To assess the economic efficiency of tour routing, operations teams should track two structural performance metrics:
A dense regional tour running five activations a week within a 100-mile radius produces a high density ratio, keeping the transition cost per stop low. Conversely, a cross-country sprint visiting three cities in seven days produces a low density ratio, where brands spend the majority of their budget moving hardware rather than engaging target consumers.
Mastering route planning for mobile sampling tours requires building risk buffers into long legs. Establishing geographic clusters allows teams to execute multiple consumer touchpoints around retail partner locations, festivals, and high-footfall corridors before initiating long highway transfers.
Market transitions represent high-risk operational handoffs. Moving a footprint from one metropolitan market to another involves significant mechanical, logistical, and regulatory complexity. Treating a city transfer as a casual road trip invites compounding delays that threaten upcoming event footprints.
Transitions should operate like structured industrial changeovers. Before a sampling vehicle departs a completed market, the field team must complete a rigorous closeout protocol.
A comprehensive market changeover protocol includes twelve core tasks:
To prevent unready assets from deploying, teams should implement a formal "Ready-to-Deploy Gate" before each market launch:
Inventory levels match scheduled footfall targets, lot numbers are logged, and cold-chain compliance logs show zero temperature spikes.
Vehicle systems are functional, generators have sufficient fuel reserves, display hardware is undamaged, and safety gear is verified.
Local site permits are on file, venue access codes are confirmed, staff rosters are filled, and digital data collection devices are tested and synced.
If any element fails the readiness gate, the tour manager addresses the issue before the vehicle departs, avoiding expensive emergency field fixes at the next stop.
Uncontrolled product loss silently inflates sampling tour costs. Distributing perishable food, chilled beverages, or high-value packaged goods across multiple markets exposes inventory to shrinkage, damage, thermal degradation, and misplacement.
Relying on end-of-tour estimates to calculate inventory usage makes it impossible to pinpoint when or where product was lost. Mobile sampling operations require daily mass-balance inventory accounting.
Every missing unit represents paid product cost, freight expense, and cold-chain handling that generated zero consumer value.
Field managers must track product waste across eight distinct categories:
Product exceeding its allowable shelf life due to slow market velocity or poor stock rotation.
Crushed packaging, broken seals, or dented cans caused by improper vehicle tie-downs or rough transit conditions.
Perishable items exposed to out-of-spec temperatures due to generator failures, power outages, or forgotten cooler latches.
Samples pre-poured, cut, or heated that were not distributed during the activation window and cannot be legally served later.
Liquid spilled during active dispensing, fallen items, or damaged primary packaging during prep.
Unauthorized staff eating, unlogged sampling, or giveaways that bypassed official counter tracking.
Product unboxed and prepped at outdoor stations that suffered weather damage from sudden rain or extreme heat.
Stock misplaced, left behind in temporary hotel freezers, or lost during cross-dock transfers.
Mitigating waste requires active demand-driven preparation. Ambassadors should prepare samples in small batches synchronized with footfall waves rather than staging hundreds of samples in advance.
Establishing precise portion control protocols and providing clear staff guidelines for handling leftover product preserves inventory integrity across extended campaigns.
Mobile tours require responsive warehousing networks. Relying exclusively on onboard vehicle capacity limits sample inventory, forcing frequent restocks that disrupt routes. Conversely, leasing large regional warehouse spaces in every market introduces massive fixed overhead.
An efficient supply chain balances central inventory staging hubs with localized micro-storage. Central depots hold primary inventory reserves, while mobile tour vehicles carry working inventory designed for immediate market stops.
Calculating reorder points for forward staging locations prevents costly stockouts and emergency freight shipments.
Safety buffers are vital for mobile operations. A highway closure, broken cross-dock lift gate, or delayed freight carrier can stall inventory deliveries. Setting safety stock at 20 to 30 percent of market demand protects the activation schedule against unforeseen logistics friction.
Managing storage networks requires addressing specific supply chain parameters:
Perishable goods require certified cold-storage facilities with automatic backup power and continuous digital temperature logging.
Staging warehouses must have loading docks and material handling equipment capable of receiving 53-foot dry vans or reefers and transferring stock into smaller sprinters or box trucks.
Tour teams often require early morning or late night access to restock vehicles outside standard consumer activation windows.
Facilities must be capable of receiving, palletizing, and shipping unused, non-perishable promotional assets back to central distribution centers at the conclusion of a tour leg.
Designing a robust storage network ensures that field teams maintain adequate product inventory to hit consumer trial targets without turning the sampling vehicle into an overstuffed, unsafe warehouse on wheels.
Operational efficiency is useless if it harms experiential quality or compromises data integrity. The EventTrack study shows that leading experiential brands assess program performance across multiple dimensions. In that study, 87 percent of marketers cited total attendees or participants, 70 percent cited attendee feedback, 59 percent cited lead generation, and 55 percent cited direct Return on Investment. Dwell time was measured by 31 percent of respondents, while 25 percent tracked cost per lead.
A high-performing mobile sampling tour must evaluate field success through an integrated measurement stack across three distinct layers:
Cutting on-site staff to reduce payroll is counterproductive if survey completion drops by half and data quality deteriorates. If an activation captures 500 bogus email addresses because staff rushed conversations to hit artificial volume goals, the program has wasted marketing capital. Understanding measuring the business impact of live sampling requires treating data collection as an operational discipline equal to sample distribution.
At the conclusion of a tour, each visited market should be evaluated by its net commercial contribution rather than surface-level attendance.
Evaluating markets through this lens reveals which venue profiles, footprint configurations, and city stops produce actual business pipeline versus those that simply look busy.
Executing an operationally lean mobile sampling tour requires strict discipline across every phase of planning and deployment. This playbook provides step-by-step guidance for field operations teams.
To understand how operational cost control functions in live environments, consider a fast-moving consumer goods food and beverage brand launching a premium ready-to-drink functional tea across four metropolitan markets over a twelve-week campaign.
In our experience, designing mobile activations and roadshows that accelerate consumer trial, build trust, and boost retail velocity during 90-day product launch windows requires strict adherence to operational baselines. Our structured approach transforms initial product trial into sustained consumer confidence and retail performance.
The brand initially faced escalating expenses during its first pilot tour. Footprints were taking two hours to assemble, ambassadors were hired on a single high-cost wage tier for all tasks, and significant inventory was lost to thermal breakdown in summer heat.
The operations team executed an overhaul of the footprint logistics. First, they restructured on-site labor. Heavy setup and teardown tasks were assigned to dedicated two-person logistics specialists at market rates, while four consumer-facing brand ambassadors arrived only when the footprint was fully operational. This eliminated paid waiting time for ambassadors and cut setup time from 120 minutes to 45 minutes.
Second, the team redesigned the sampling workflow. Instead of pre-pouring hundreds of sample cups that warmed in the sun, ambassadors utilized rapid-dispense draft systems drawing directly from insulated, temperature-controlled keg units inside the vehicle. This cut product waste from 18 percent to under 2 percent and ensured every sample was served at optimal drinking temperature.
Third, the route was restructured from a scattered multi-state path into dense market clusters centered around key regional grocery retail partners. This increased the Route Density Ratio from 0.8 to 2.4, delivering three times as many consumer-facing hours per transit day. For related context on retail-driven execution, see how mobile tour execution for beverage retail sales leverages field marketing to drive velocity at the store shelf.
The commercial results demonstrated the impact of operational discipline:
By treating the mobile tour as an integrated operational system rather than a traveling marketing display, the brand captured high-volume consumer trial while protecting bottom-line campaign margins.
Improving operational efficiency across your mobile marketing operations begins with evaluating your existing field practices. Here is an actionable checklist your team can implement this week:
Applying operational rigor to field logistics allows marketing teams to eliminate budget waste, protect consumer brand perceptions, and generate measurable commercial pipeline on every tour stop.

30 Years Experiential & Retail Activation Partner for CPG & Beverage Brands | Multi-Market Demos, Roadshows & Costco/Club Programs That Actually Sell