Robbie Thain
Founder, CEO

Campus energy is not pipeline, so this walks through a five-tier measurement hierarchy, attribution choices and the metrics that survive a CFO review.
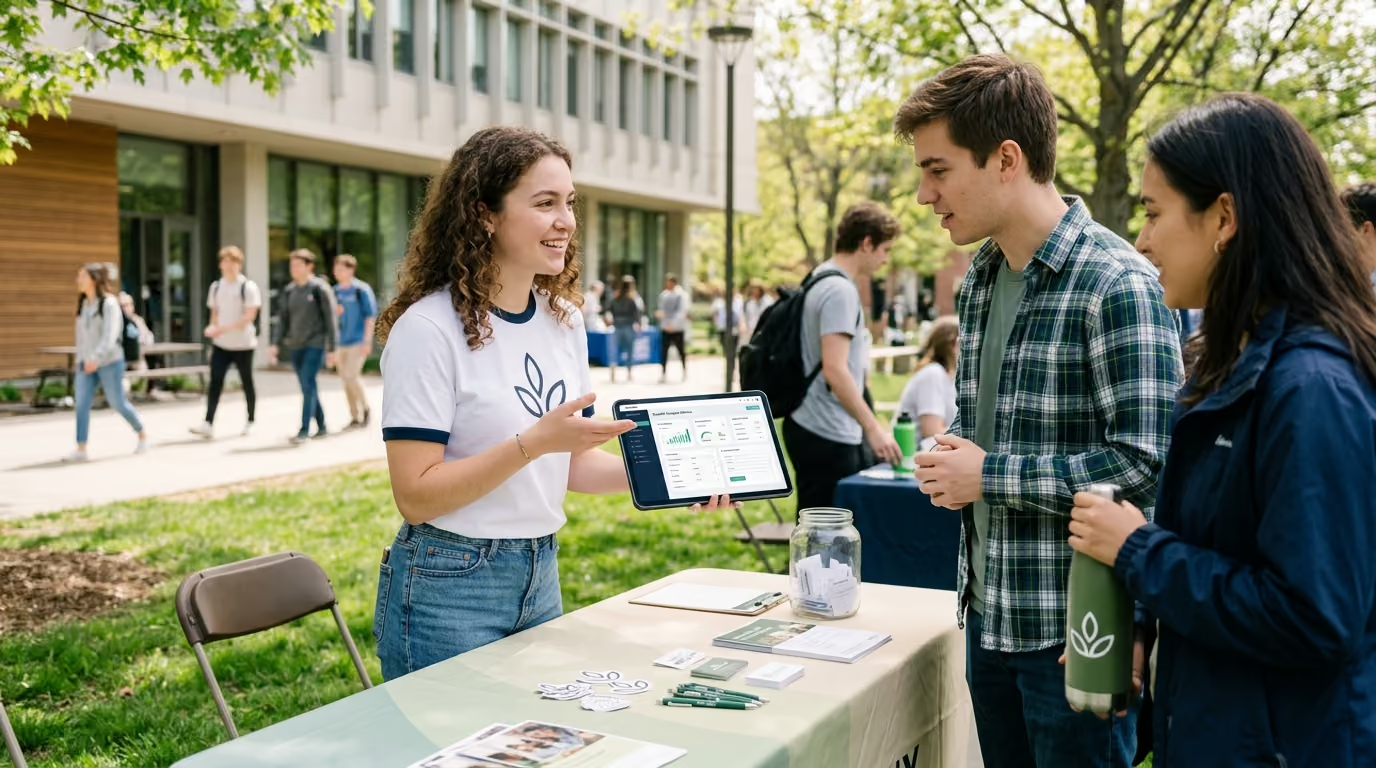
Most campus marketing programs track vanity metrics like social impressions and handed-out samples, yet these numbers fail to prove commercial viability to executive leadership. A rigorous Return on Investment (ROI) measurement framework isolates incremental sales lift, accounts for total program expenditures, and connects peer-to-peer campus activations directly to verified retail and digital conversions.
Campus marketing campaigns often produce high energy that fails to translate into clear financial reporting. Brand directors frequently see massive social reach figures and empty sample boxes, yet local retail velocity remains unchanged. Without a structured attribution framework, field marketing teams cannot distinguish between genuine customer acquisition and passive giveaway waste.
Trade show floors and college campuses share an identical operational hazard. Both environments generate heavy foot traffic, loud interactions, and high volumes of distributed collateral. Marketing teams often mistake this physical activity for revenue generation. A crowded quad or a packed Greek life presentation creates the illusion of success, but commercial pipeline requires verifiable consumer action.
When brand ambassadors hand out thousands of product units between lecture halls, traditional reporting logs those units as successful trials. In reality, a large percentage of those samples end up abandoned in dormitory trash bins or taken by individuals outside the target demographic. Without a closed-loop digital mechanism or store-level verification, field teams cannot track what happens after the initial handoff.
This lack of visibility creates friction between experiential field teams and finance departments. Brand managers celebrate high participation counts while finance leaders examine flat scan data at surrounding grocery and convenience retailers. Bridging this gap requires treating campus activations with the same analytical rigor applied to performance marketing channels.
We have been connecting brands with people through live experiences, retail programs, and national activations since 1995. Over three decades, we have built a track record of creating meaningful brand moments across the country. That experience has proven that campus initiatives succeed only when operational discipline matches field enthusiasm. You can read more about building an operationally disciplined campus ambassador program to see how structured processes protect brand capital.
Calculating program performance requires absolute clarity on the mathematical definition of financial return. Many teams mistakenly substitute top-line revenue or media value for actual profitability. Financial Return on Investment measures the net economic gain generated by the activation relative to every dollar spent to execute it.
The baseline formula for program Return on Investment is:
Return on Investment = (Incremental Gross Profit - Total Program Cost) / Total Program Cost
When organizations choose to report top-line revenue rather than gross margin, the metric must be explicitly labeled as Return on Ad Spend or revenue efficiency. Equating unadjusted revenue to business return distorts financial performance.
To determine Incremental Gross Profit accurately, teams must use a comprehensive calculation:
Incremental Gross Profit = (Incremental Units Sold x Gross Profit per Unit) + Incremental Customer Value - Discount and Promotional Cost
Total Program Cost must capture every operational expense rather than merely ambassador hourly wages or monthly stipends. A complete cost base includes:
Omitting management overhead, shipping logistics, or promotional discounts creates an artificial sense of efficiency. An activation that appears highly profitable on ambassador stipends alone can easily become net-negative once fulfillment and compliance costs are factored into the ledger.
Distinguishing between attributed outcomes and incremental outcomes is equally critical. Attributed return assigns credit to specific touchpoints when a student uses an ambassador code or clicks a tracked link. Incremental return estimates the true net gain produced by the program compared to what consumers would have purchased without any intervention. High-performing brands report both figures to maintain operational visibility while satisfying executive governance.
A mature campus measurement program operates as an interconnected funnel rather than an isolated campaign summary. Tracking data across five distinct tiers allows operators to locate friction points and optimize resources during the semester.
Activity metrics document the execution volume generated by the field team. These operational data points verify that ambassadors fulfill their contractual obligations:
These metrics establish operational accountability across markets. However, high activity volume does not automatically prove audience impact or revenue growth.
Exposure metrics evaluate the size and composition of the audience that viewed the brand activation. Standardizing these metrics prevents the overstatement of campaign influence:
Field teams must maintain clear distinctions between raw impressions and unique individuals. A student walking past an activation display three times in one morning represents three impressions but only one reached consumer.
Engagement metrics indicate that a student took active steps to interact with the brand message. Tracking actions across this tier demonstrates intent to purchase:
Engagement quality must be categorized based on commercial intent. A direct message asking where to purchase a product carries significantly higher commercial weight than a passive social media like.
This tier tracks verified movement from product interest into initial transaction. For brands selling through physical grocery or campus bookstores, tracking this transition requires strict definitions:
Tracking the conversion pathway requires analyzing online promo code redemptions, store-level sales velocity, and digital receipt uploads. Reviewing our guide on how to build a student ambassador program that drives sales highlights specific operational mechanisms for connecting sampling to point-of-sale systems.
The final tier assesses the enduring financial return generated by newly acquired student customers:
Adjusting Customer Lifetime Value for gross margins ensures that forward-looking financial projections reflect genuine enterprise value rather than unadjusted top-line numbers.
Every campus marketing campaign must establish an explicit theory of change before field staff deploy to campus quads. A theory of change maps the exact behavioral assumptions required to turn an ambassador interaction into sustained retail velocity.
First, the program recruits socially credible students embedded within targeted student organizations, athletic clubs, and academic departments. These students complete rigorous training on product claims, brand guidelines, and legal disclosure standards. To explore compliant onboarding frameworks, examine our analysis of compliance-first ambassador training for consumer brands.
Second, ambassadors receive unique promotional codes, localized digital landing pages, and batch-coded product samples. By distributing these assets during high-density campus routines, ambassadors spark peer conversations that build category awareness.
Third, the interaction directs the student to a friction-free digital mechanism, such as scanning a custom QR code on the packaging. This action captures a first-party data point, such as an SMS opt-in or an instant digital coupon download.
Fourth, the digital asset routes the student directly to an on-campus retailer or a nearby grocery partner stocking the inventory. When the student redeems the offer at checkout, the point-of-sale scanner records the redemption and logs the specific ambassador attribution.
Fifth, automated retention workflows deliver targeted follow-up messaging that encourages a second purchase within a thirty-day window. If any link in this sequence breaks, the campaign fails to generate measurable commercial pipeline. Establishing diagnostic metrics at every stage allows operators to identify and resolve funnel leaks before marketing budgets expire.
Executing an attributable campus program requires rigorous field management protocols before, during, and after activation dates.
For programs combining physical sampling with retail merchandising, exploring strategies for connecting student ambassadors with retail demos offers additional execution frameworks.
Assigning commercial value to peer-to-peer marketing requires selecting attribution models that balance operational ease with statistical accuracy. Relying entirely on basic digital tracking models frequently misrepresents the impact of in-person campus interactions.
Last-touch attribution assigns one hundred percent of transaction credit to the final recorded touchpoint prior to checkout. This method provides simplicity and transparency when tracking direct promo code entries. However, it systematically undervalues top-of-funnel brand discovery, physical product sampling, and peer recommendations that occurred weeks earlier.
Multi-touch attribution distributes commercial credit across several consumer interactions along the path to purchase. Linear models divide credit evenly across every touchpoint, while position-based models allocate higher weights to the first discovery moment and the final conversion action.
Data-driven models evaluate historical conversion pathways to assign statistical weights based on actual consumer behavior patterns. While valuable for tracking e-commerce journeys, these models still struggle to account for untracked word-of-mouth conversations and offline grocery store purchases.
The most reliable method for evaluating campus marketing effectiveness is geographic incrementality testing. Rather than relying on click paths, incrementality testing compares treatment markets against matched control markets that received no promotional intervention.
This difference-in-differences approach isolates external market noise, such as regional economic changes, weather disruptions, and local retail pricing adjustments. If target stores near a university show a thirty percent sales increase while matched control stores show a five percent gain, the true incremental lift attributable to the campus campaign is twenty-five percent.
Executing geographic holdouts prevents marketing teams from claiming credit for sales that would have occurred naturally through existing distribution channels. You can learn more about isolating commercial growth in our guide to measuring student ambassadors as a predictable growth channel.
Analyzing documented industry campaigns illustrates how brand teams link field execution to measurable commerce.
A national apparel brand launched an ambassador initiative across select university campuses, pairing peer outreach with unique digital discount codes. The campaign generated over 1.9 million social impressions, more than 18,000 verified student conversations, and achieved an 11% coupon redemption rate.
This redemption performance outpaced the brand standard fivefold. The primary insight from this activation pattern lies in the connection between direct peer engagement and trackable digital action. However, calculating true financial return requires subtracting the gross margin lost to discount percentages from the incremental revenue generated by new buyers.
A prestige beauty brand executed a campus tour combining physical product sampling with immediate survey capture. The operational footprint yielded over 9,600 distributed samples and 4,770 direct peer consultations across 45 campus events.
By requiring a digital scan to participate in the sampling experience, the field team gathered more than 730 post-trial survey completions. The research panel indicated that 61% of participating students planned to continue purchasing the product line, while 79% expressed clear intent to recommend the brand to peers.
While self-reported intent provides useful diagnostic data regarding brand sentiment, operators must validate those claims against store-level retail velocity over the following quarter. For fast-moving consumer goods, reviewing how CPG brands scale student ambassador programs to lift retail velocity provides practical benchmarks for closing the survey-to-scan gap.
A retail fashion organization activated a nationwide collegiate marketing network that yielded 53,000 unique social content assets and generated over 103 million campaign impressions. The initiative produced $2.2 million in tracked sales directly attributed to ambassador-specific promotional codes.
This case illustrates the massive revenue volume achievable through structured campus networks. To establish true economic Return on Investment, the organization must account for total product gifting expenses, ambassador commissions, platform licensing, and the baseline sales rate that would have occurred without promo codes.
Campus marketing programs face unique environmental variables that can distort reporting if analysts fail to account for operational edge cases.
A customer who is already committed to buying a product will readily search for an ambassador discount code to lower their checkout total. Crediting that transaction entirely to the ambassador program inflates reported Return on Investment while eroding product margins. Marketing teams must implement control groups or pre-period baselines to isolate existing customer behavior from genuine net-new acquisitions.
A high-volume sampling campaign can generate impressive top-line revenue while simultaneously destroying operating profitability. If an ambassador distributes high-value coupons offering steep discounts, the variable cost of goods and retail fulfillment fees can exceed the net revenue generated. Financial reporting must evaluate contribution margins after deducting every promotional markdown and shipping cost.
Comparing raw sales totals between universities creates misleading performance evaluations. A flagship state university with 50,000 residential students will naturally produce higher gross sales than a private urban college with 8,000 commuter students. Performance metrics must be normalized by campus population density, nearby retail store counts, and baseline brand awareness.
College campuses experience severe operational seasonality that digital channels avoid. Measuring sales velocity during move-in week, homecoming, midterms, or spring break without controlling for the academic calendar creates significant reporting bias. Pre-period baselines must compare equivalent academic windows from prior years rather than comparing active school months to summer vacation periods.
An ambassador team may execute flawless campus events and generate massive consumer intent, but if local grocery shelves remain unstocked, conversion drops to zero. Tracking systems must incorporate retail inventory levels and out-of-stock reports into performance scorecards. Failing to align field promotions with retail inventory creates wasted demand and skews acquisition calculations.
Building an executive-level reporting dashboard requires organizing metrics into distinct leading and lagging indicators across efficiency, quality, and financial performance.
Leading indicators track early operational momentum and consumer engagement before sales transactions appear in quarterly financial reports:
Lagging indicators evaluate final commercial performance and confirm whether the campaign produced profitable customer relationships:
Separating early engagement signals from verified financial outcomes gives brand directors the operational agility to adjust field tactics mid-semester while providing executive stakeholders with defensible performance data.
Measuring campus marketing with operational discipline transforms peer-to-peer activations into a predictable, high-converting customer acquisition channel.
#

30 Years Experiential & Retail Activation Partner for CPG & Beverage Brands | Multi-Market Demos, Roadshows & Costco/Club Programs That Actually Sell