Robbie Thain
Founder, CEO

Four times standard unit volume during in-store demos often obscures true lift, requiring matched control stores to calculate accurate incremental profit.

A rigorous measurement framework isolates true incremental sales from baseline retail velocity through randomized controls, matched store designs, and multi-week post-period tracking. By accounting for pull-forward demand, brand cannibalization, and long-term repeat purchases, consumer packaged goods brands can prove defensible Return on Investment (ROI) across every live activation.
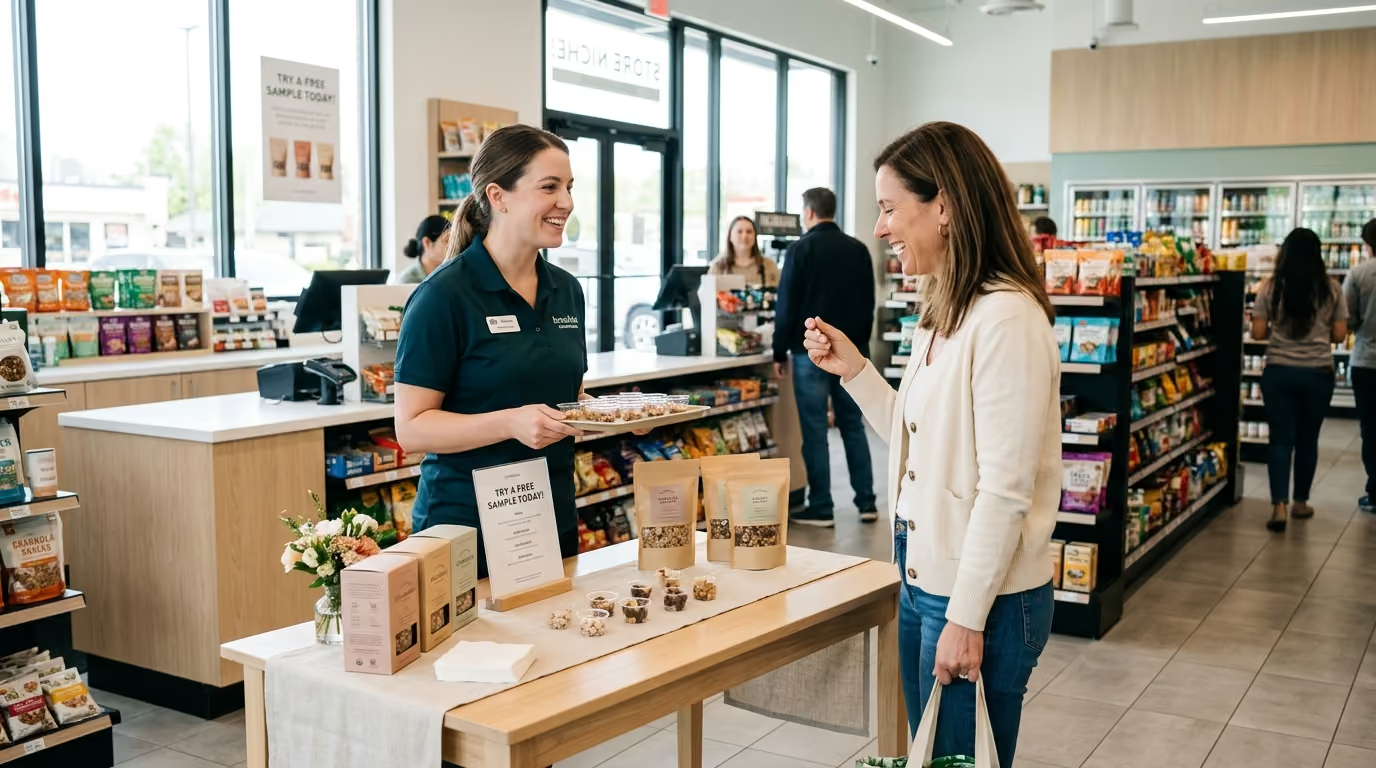
A Saturday afternoon sampling activation inside a high-volume grocery store often looks like an undeniable victory. Shoppers crowd the portable demo cart, tasting product samples and dropping items into their carts while the field team logs hundreds of completed engagements. By Monday morning, point-of-sale scanner data shows that the store moved four times its standard daily unit volume for that stock-keeping unit. Brand managers celebrate the spike, yet finance leaders remain skeptical because raw sales numbers hide the counterfactual reality. Without a disciplined measurement framework, you cannot determine whether those units represent net-new volume, subsidize shoppers who planned to buy anyway, or pull demand forward from the following week.
True incrementality represents the volume of sales that occurred directly because of the activation and would not have occurred without it. Industry research from NielsenIQ defines incremental sales as the volume generated above an expected baseline, calculated simply as total observed sales minus base sales. The central challenge of physical retail measurement is that the unobserved counterfactual cannot be measured in the exact same store at the exact same moment. Marketers must construct an accurate statistical proxy using control groups, matched stores, or baseline models.
Observed sales capture every unit that passes through the register during the activation window. In contrast, baseline sales represent the volume the store would have sold under normal operating conditions without promotional staff or active demonstrations. If a retail location typically sells 350 units of an item over a weekend and moves 500 units during a sampling event, the apparent increase is 150 units. If an unactivated sister store in the same market also grew by 100 units due to category trends, the true incremental lift is roughly 50 units.
To quantify promotional performance accurately, brand operators rely on several foundational formulas:
Incremental Units = Actual Test Period Units - Expected Baseline Units
Incremental Lift Percentage = (Incremental Units / Expected Baseline Units) * 100
Incremental Revenue = Incremental Units * Net Realized Selling Price
Incremental Profit = Incremental Revenue - Cost of Goods Sold - Total Activation Cost
NielsenIQ frameworks evaluate promotional returns by dividing total promoted volume by baseline volume to index overall effectiveness. For financial validation, incremental revenue must always serve as the foundation of your return calculations. Using total sales volume in the numerator overstates performance, leading to misallocated trade marketing budgets.
Before selecting a testing design, field leaders must establish the specific business question the program aims to answer. A sampling initiative designed to generate immediate register conversion requires a different measurement architecture than an initiative designed to drive long-term household adoption. Without clear parameters, post-campaign analysis produces conflicting interpretations across sales, brand, and finance teams.
Sampling campaigns typically target one or more distinct commercial outcomes:
Academic research published in the Journal of Retailing demonstrates that in-store product sampling generates both immediate conversion spikes and durable long-term carryover effects. The researchers discovered that repeated sampling events establish sustained sales momentum that decays much more slowly than single-event promotions. Clarifying your primary objective establishes your target population, the required post-event monitoring window, and the statistical confidence threshold necessary for executive sign-off.
When planning national retail campaigns, we frequently see brands struggle because they measure only the hours when staff occupy the aisle. Over three decades of executing national sampling tours and retail demonstrations since 1995, our team has found that true commercial lift reveals itself over weeks, not just hours. Structuring your test around complete purchase cycles provides the visibility required to justify ongoing trade marketing investments. For brands seeking to connect field engagements with register scan data, mastering how to turn product sampling into actual retail sales requires disciplined alignment across all retail stakeholders.
Field marketers must balance methodological rigor against the operational constraints of commercial retail environments. Different retail partners offer varying levels of data transparency, geographic isolation, and inventory reporting. Choosing the right measurement model ensures your analytical conclusions remain defensible.
Randomized control trials represent the gold standard for causal inference in physical retail. In this structure, eligible retail locations within a defined network are randomly assigned to either a treatment group that receives the activation or a control group that receives no promotional intervention. Randomization effectively balances observed and unobserved variables across both sets of stores.
Random assignment can occur across several operational levels:
Randomized market trials are particularly effective when testing bundled retail packages that combine live demonstrators, temporary endcap displays, temporary price reductions, and digital retail media. Randomizing the entire package allows brands to evaluate the true aggregate return of the commercial intervention.
When commercial obligations or retailer arrangements prevent random store assignment, marketers must build a matched-store quasi-experiment. This method pairs each activated treatment store with an unactivated control store that shares nearly identical operating characteristics. Selecting appropriate matching variables prevents baseline differences from contaminating your final incremental lift calculations.
Effective matching criteria should incorporate:
Selecting control stores based on sales volume alone is a critical mistake. A store generating high volume on a downward trend cannot serve as an effective benchmark for an equally high-volume store experiencing rapid organic growth. Both baseline volume and pre-period momentum must align to validate the counterfactual comparison.
Difference-in-differences analysis evaluates the change in performance across treatment stores relative to the change observed across control stores over the identical calendar window. This methodology removes static differences between store groups as well as broader macro trends that impact the entire retail market simultaneously.
The basic formulation operates as follows:
Incremental Volume = (Treatment Post-Volume - Treatment Pre-Volume) - (Control Post-Volume - Control Pre-Volume)
Consider an activation where treatment stores average 1,000 units weekly before the event and rise to 1,400 units during the campaign window, representing a gross gain of 400 units. If matched control stores move from 1,050 units to 1,250 units over the same period due to seasonal category lift, the control group experienced an organic increase of 200 units. Subtracting the 200 units of organic market growth from the treatment group's 400-unit gross increase leaves an accurate incremental estimate of 200 units.
Advanced measurement teams frequently deploy synthetic difference-in-differences models. Rather than relying on individual paired stores, synthetic controls build a mathematically weighted combination of multiple non-activated stores to mirror the exact historical trajectory of the treatment group. This approach reduces idiosyncratic store-level noise, creating an exceptionally stable counterfactual baseline.
When a retailer cannot provide concurrent control store data, analysts must rely on longitudinal baseline projections built from historical store performance. This approach models expected unit volume by analyzing historical point-of-sale patterns across the specific treatment locations.
A reliable historical baseline model requires:
While historical modeling provides a workable estimate when control stores are unavailable, it remains vulnerable to external shocks. Unseasonable weather, local economic shifts, sudden competitor promotions, or supply chain disruptions can distort the projected baseline, leading to misattributed sales gains.
Isolating incremental sales requires setting strict time horizons that capture the complete lifecycle of consumer response. A common pitfall is analyzing only the hours when brand ambassadors stand beside the sampling station. A complete analytical model spans three distinct operational phases.
The pre-period establishes the normal baseline trajectory for every store in the study. For fast-moving consumer packaged goods with high purchase frequencies, a four-to-six-week pre-period is often sufficient to establish statistical normality. For premium, specialty, or low-velocity products with longer consideration cycles, analysts should establish a pre-period of eight to twelve weeks.
The pre-period allows analysts to verify that treatment and control groups display parallel trends before any marketing intervention occurs. If the two groups show diverging sales velocities prior to the activation, the matching algorithm must be recalibrated. The pre-period also highlights baseline out-of-stock patterns, allowing teams to exclude erratic stores before testing begins.
The activation window encompasses the direct execution period, capturing both active demonstration hours and adjacent shopping shifts. For same-day in-store sampling, capturing hourly or transaction-level scanner records helps distinguish direct demonstration lift from general store traffic trends. Logging precise operational details, including actual start times, end times, and staffing compliance, ensures that analysts evaluate performance against actual field delivery.
The post-period is critical for capturing repeat purchases while identifying potential volume distortions like stockpiling and demand pull-forward. A short-term volume spike during an event does not guarantee commercial success if sales drop significantly below baseline over the subsequent month. When consumers purchase multiple discounted units during an activation, they may simply fill their home pantries, delaying purchases they would have made anyway.
Tracking post-activation performance across standardized intervals provides clear operational visibility:
Evaluating retail performance over extended post-periods reveals whether the activation generated genuine trial or merely altered the timing of routine transactions. Understanding these multi-week patterns is a core component of measuring experiential sales lift across modern retail networks.
Accurate incrementality modeling requires merging distinct data streams into a unified analytical repository. Relying exclusively on high-level weekly scanner summaries obscures the operational factors that drive local store performance. A robust data foundation bridges store scanner logs, field execution reports, and external contextual variables.
At the individual store, SKU, and date level, analytics teams must aggregate:
Field management teams must systematically document store-level execution quality:
To isolate marketing lift from broader market fluctuations, the analytical model should incorporate external variables:
When partnering directly with retailers through modern media networks, brands can access anonymized shopper-level data to evaluate behavioral shifts:
Integrating loyalty card records allows marketers to leverage emerging retail media incrementality measurement tools, transforming physical sampling interactions into closed-loop attribution models.
Executing an incrementality test requires disciplined coordination across brand management, field operations, retail sales teams, and analytics leads. The following step-by-step workflow outlines how to plan, execute, and evaluate a statistically valid in-store retail test.
Measuring in-store retail activations requires tracking both real-time operational execution and downstream financial returns. Leading indicators reflect the quality of in-store execution, while lagging indicators demonstrate true commercial incrementality.
When evaluating broader field marketing initiatives, incorporating standardized field marketing performance metrics ensures that experiential activations remain accountable to executive leadership.
A complete measurement model looks beyond the specific SKU being sampled. In-store activations trigger complex shopper behaviors across adjacent product lines, competing brands, and broader retail departments. A sampling event that increases sales of one SKU by pulling volume from another item in your product line does not deliver true enterprise growth.
While the sampled item may demonstrate impressive velocity, analysts must measure the aggregate impact across the entire brand portfolio. Research indicates that live brand interactions often generate a halo effect, lifting sales of non-sampled flavors, alternative package sizes, and premium line extensions. Conversely, if shoppers simply switch from an unpromoted flavor to the sampled variety, the brand experiences internal cannibalization.
Net Brand Incremental Volume = Focal SKU Incremental Units - Cannibalized Portfolio Units + Halo Portfolio Units
Evaluating net portfolio impact ensures trade marketing funds support overall brand growth rather than subsidizing internal product substitution.
Retailers prioritize brand activations that grow the overall category rather than those that merely shift market share between competing manufacturers. Rigorous academic studies from the Journal of Retailing confirm that in-store sampling frequently expands total category demand by attracting new consumers to the aisle and stimulating unplanned category purchases.
Demonstrating category expansion transforms your retail relationship. When you prove to a category merchant that your sampling program increased total category dollar sales, you position your brand as a strategic category captain. This evidence provides significant leverage during annual line reviews, shelf space negotiations, and promotional planning sessions.
Live sampling can alter overall basket dynamics across the store. An activation featuring an artisanal salad dressing or premium pasta sauce can drive attach purchases in adjacent departments, such as fresh produce, specialty cheeses, or bakery items. Analyzing transaction-level basket data reveals whether the activation generated cross-category value, enhancing retailer margins and strengthening the commercial case for ongoing in-store programs.
To illustrate this measurement framework, consider a national refrigerated food brand launching an innovative plant-based entree across a major supermarket chain. The brand partnered with our field operations team to deploy a high-touch sampling program across 60 retail locations, reserving 60 carefully matched stores within the same marketing regions as unactivated controls.
The matching algorithm paired stores based on eight weeks of pre-period scanner data, matching for baseline entree velocity, category volume share, store format, and local household income. Treatment stores received four weekend demonstration shifts over two consecutive weeks, supported by branded sampling stations, trained culinary demonstrators, and temporary promotional price tags. Control stores maintained identical shelf placement and regular pricing but received no sampling support.
In our experience over three decades of field execution, operational consistency across store fleets makes or breaks testing accuracy. Our supervisors conducted real-time audits using digital verification tools, ensuring that 100% of treatment stores maintained full on-shelf stock and display compliance throughout the four-hour demonstration windows.
The difference-in-differences analysis tracked store scanner data across the two-week activation window and eight subsequent post-event weeks:
By proving that the campaign generated net-new category revenue rather than temporary promotional cannibalization, the brand successfully secured permanent secondary placement across the retailer's entire store network. Connecting these structured demonstration models to broader retail distribution mirrors the operational principles behind connecting roadshows to retail sell-through.
Isolating incremental sales from in-store retail activations requires avoiding several methodological traps that can undermine campaign evaluations.
The most widespread mistake in retail marketing is treating total register sales during an activation as campaign-generated volume. High-volume retail stores naturally move substantial product volume without marketing support. Failing to subtract expected baseline volume produces inflated ROI claims that lose credibility during executive financial reviews.
Using sales from the week immediately preceding an activation creates significant baseline bias. A single week can be distorted by temporary weather events, local pay cycles, competitor out-of-stocks, or localized delivery delays. Constructing a baseline from an extended multi-week pre-period provides a far more stable benchmark for comparative analysis.
Retail sales directors frequently select their highest-performing, flagship locations for field activations. Comparing these high-traffic stores against the overall chain average confounds marketing impact with underlying store volume. If you activate top-tier urban stores, your control group must consist of equally high-performing urban locations.
A sampling activation cannot drive register conversion if the store shelf runs out of stock halfway through the afternoon. Unrecorded stockouts lead analysts to underestimate campaign performance, misinterpreting supply chain failures as weak consumer demand. Rigorous testing protocols must isolate out-of-stock hours to evaluate true consumer conversion potential accurately.
Evaluating performance strictly on event day obscures potential demand pull-forward. If shoppers buy multiple units during an activation simply to take advantage of a temporary discount, sales over subsequent weeks often drop below baseline. Extending your analytical horizon across an eight-to-twelve-week post-period ensures that your final reporting captures true net incremental volume.
When planning your next retail campaign, revisit this resource during the initial campaign scoping phase, prior to finalizing retailer agreements, and before locking your post-campaign analytical frameworks. Maintaining rigorous control groups and disciplined post-period tracking ensures that every physical activation delivers measurable, defensible enterprise value.

30 Years Experiential & Retail Activation Partner for CPG & Beverage Brands | Multi-Market Demos, Roadshows & Costco/Club Programs That Actually Sell