Robbie Thain
Founder, CEO

College sampling events often generate high foot traffic without driving retail sales, requiring structured measurement frameworks to verify actual.
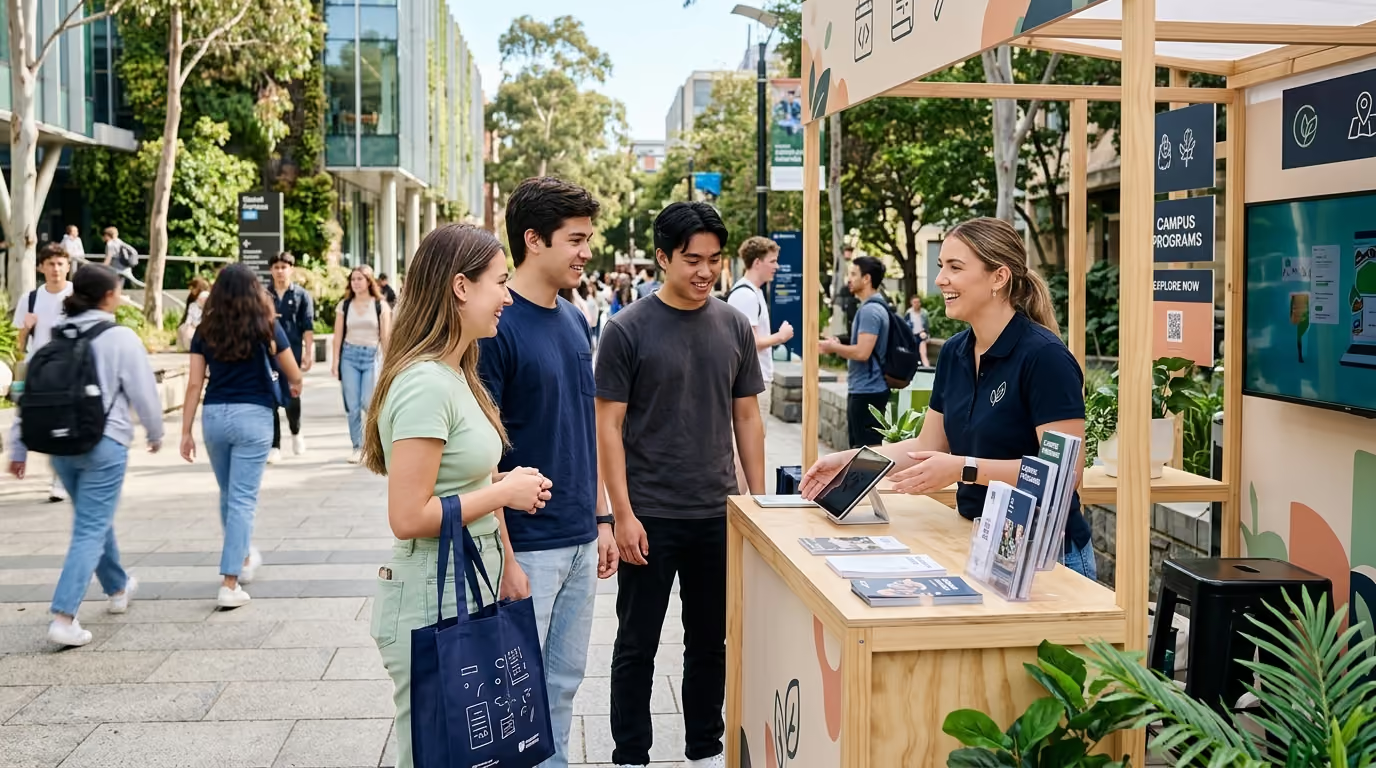
A standardized campus activation measurement framework allows brand leaders to evaluate disparate field programs using consistent units of analysis, full cost modeling, and causal incrementality. By separating baseline brand exposure from verified retail behavior, marketing teams can direct campus budgets toward activations that produce repeatable commercial value.
Campus quads during midterms or orientation week present an operational environment unlike any traditional retail channel. Brand ambassadors hand out energy drinks from iced tubs while student flyers blanket the sidewalk, competing for the attention of undergraduates rushing between lecture halls. Marketing directors receive post-event recaps loaded with inflated figures, claiming fifty thousand impressions based entirely on university registrar headcounts. Cardboard displays collapse in sudden rainstorms, QR codes route to broken web pages, and local convenience stores run out of inventory before the midday campus rush even begins. When the spring semester ends, leadership holds a stack of agency summaries full of vanity metrics, unable to determine whether a residence hall sampling tour, a fraternity sponsorship, or a student union pop-up drove actual retail velocity.
The most common error in college marketing is treating operational busyness as a proxy for business growth. Handing out ten thousand product units proves only that free items are popular, not that students formed brand affinity or intend to purchase. A campus deployment can exhaust its entire product allocation within three hours without generating a single verified retail customer.
To evaluate field programs accurately, operators must distinguish delivery metrics from commercial outcomes. In our experience managing field activations since 1995, we have seen that high-volume distribution often masks low-quality audience targeting. When brand teams confuse operational throughput with consumer acquisition, they misallocate funding to programs that merely distribute free samples to non-buyers.
To prevent this confusion, field leaders must classify every reported metric into one of five distinct verification categories:
Observed metrics represent raw operational activities recorded directly by field staff during the event. These numbers include total physical samples handed to pedestrians, scheduled shifts completed by ambassadors, and hours logged on campus. They confirm that the team executed the planned schedule. They do not provide evidence of product trial, message comprehension, or downstream retail purchase.
Attributed metrics link a specific consumer action directly to the activation through a trackable digital or physical identifier. Examples include unique promotional code redemptions at local retail checkouts, verified QR code scans at the sampling footprint, and first-party SMS opt-ins. These figures prove direct interaction with the campaign asset. They show that an individual engaged with the brand through a designated channel.
Modeled metrics use statistical formulas or marketing mix modeling to estimate broader campaign effects across a sales territory. These numbers calculate regional lift by analyzing historical purchasing trends, competitor promotions, and local media weight. They help brand teams understand macro-level demand shifts across regional grocery and convenience accounts. They do not isolate individual consumer journeys at a single university.
Incremental metrics isolate the specific commercial volume that occurred solely because of the campus activation, measured directly against an unexposed control baseline. These figures show the true net gain in customer acquisition, revenue, and product velocity. Establishing incrementality requires matched control campuses or holdout zip codes. It is the only metric category that proves whether the activation generated net new sales.
Projected metrics estimate future customer lifetime value and repeat purchase cycles based on historical category retention assumptions. These figures help finance teams evaluate long-term Return on Investment (ROI) for customer acquisition programs. They rely heavily on post-event behavioral assumptions. Marketing leaders must never report projected figures as settled historical revenue.
Comparing a multi-campus brand ambassador tour against a one-day student union sampling installation is impossible without standardized units of measurement. When one field team defines reach as total campus enrollment while another defines it as badge scans, cross-program analysis breaks down completely. Marketing executives must establish rigid definitions across every campaign tier before launching field operations.
Standardizing these parameters eliminates agency inflation and allows finance teams to benchmark performance across different regions, universities, and activation formats. To learn how to select target locations based on demographic density and retail proximity, explore the definitive framework for choosing the right college campuses.
An activation unit represents a distinct, planned field marketing deployment with a dedicated budget, defined geographic footprint, specific target audience, and set execution window. An activation can take the form of an eight-week peer ambassador program, a weekend sports tailgate footprint, or a three-day dining hall takeover. Each activation unit requires its own isolated cost tracking, staffing ledger, and conversion goals.
An exposure occurs when a target student has a confirmed visual and physical encounter with the brand footprint. Total campus enrollment figures, general pedestrian walkway counts, and gross social media impressions do not qualify as verified exposures. Exposure verification requires physical check-ins, geofenced perimeter confirmation, or direct interaction counts validated by field supervisors.
A meaningful interaction represents an exposure that satisfies predefined operational depth criteria. These criteria require a two-way verbal dialogue lasting at least forty-five seconds, an active product demonstration, or a confirmed tasting experience. Distributing a cold beverage sample into a backpack is merely distribution; walking a consumer through ingredient benefits while they consume the sample constitutes a meaningful interaction.
A qualified participant is an individual who matches the brand target consumer profile and possesses immediate access to local retail distribution. Qualification factors include enrolled student status, category purchasing habits, age verification, and geographic residence within two miles of retail partner stores. Engaging consumers who live outside the distribution territory dilutes the commercial value of the field program.
A primary conversion represents the immediate target commercial action of the campaign, such as purchasing a product, redeeming an exclusive retail voucher, or downloading a mobile ordering application. Secondary conversions include intermediary engagements, such as subscribing to an email newsletter, following an athletic sponsorship account, or participating in a digital campus contest. Field scorecards must isolate primary revenue actions from secondary digital engagement.
An incremental conversion represents a qualified commercial transaction that would not have occurred without the field marketing intervention. To measure incremental lift accurately, analytics teams apply a difference-in-differences calculation comparing exposed campuses to matched control campuses:
Incremental Lift = (Post-Treatment Metric - Pre-Treatment Metric) - (Post-Control Metric - Pre-Control Metric)
This statistical calculation strips away ambient baseline sales, seasonal purchase spikes, and national media support, leaving only the net volume generated by the campus field team.
A complete campus measurement architecture requires a structured, multi-layered data model rather than a single aggregated performance score. Evaluating programs across seven distinct evaluation tiers prevents teams from over-indexing on top-of-funnel activity or misinterpreting short-term retail fluctuations.
Establishing clear metrics across every tier allows brand operators to identify exact operational bottlenecks, whether in staff recruitment, field messaging, or retail inventory execution. For teams structuring field performance scorecards, 5 metrics to prove field activation ROI beyond vanity metrics provides a baseline for tracking high-value consumer actions.
Execution metrics track whether the field team fulfilled contractual and operational requirements on the ground. These indicators establish basic operational reliability across every target campus market:
Reach metrics calculate the exact volume of verified target consumers who engaged with the physical footprint or ambassador network. This layer eliminates duplicate counting across multi-day campaigns:
Engagement metrics evaluate how effectively the on-campus footprint held consumer attention and communicated key brand messaging:
Audience qualification metrics verify that field interactions occurred with high-value consumers who match the core buyer persona:
Behavioral metrics evaluate immediate, trackable actions taken by students to continue their relationship with the brand post-encounter:
Commercial metrics determine the direct financial contribution of the campus deployment across physical and digital retail channels:
Causal metrics isolate true net financial return after accounting for all campaign expenditures, product costs, and baseline sales trends:
Evaluating campus initiatives across different universities, budgets, and operational formats requires standardized efficiency ratios. Comparing total product distribution numbers between a large state university and an urban private college creates false conclusions. Normalizing data using consistent financial and operational denominators creates an objective baseline for strategic capital allocation.
To understand how budget allocations translate into street-level execution costs, review 2026 budget benchmarks for street team and product sampling activations.
Cost per Verified Unique Reach measures the efficiency of delivering qualified physical exposure to unique target individuals:
Cost per Verified Unique Reach = Total Program Cost / Verified Unique Reach
This metric evaluates high-visibility footprints, such as orientation week takeovers and athletic fan zones, where broad brand exposure within the collegiate demographic is the primary campaign objective.
Cost per Qualified Participant isolates spending directed strictly at high-value consumers who match targeting parameters:
Cost per Qualified Participant = Total Program Cost / Qualified Unique Participants
This formula prevents field teams from masking poor demographic targeting by handing samples to non-students, campus visitors, or individuals residing outside retail distribution zones.
Cost per Meaningful Interaction benchmarks the cost of conducting in-depth, two-way consumer conversations and demonstrations:
Cost per Meaningful Interaction = Total Program Cost / Meaningful Interactions
This calculation provides a vital efficiency benchmark for peer ambassador cohorts and high-touch sampling installations that prioritize deep consumer education over rapid product distribution.
Cost per Verified Trial calculates the exact investment required to place a consumed product sample into a target consumer's hands:
Cost per Verified Trial = Total Program Cost / Verified Product Trials
This metric requires field confirmation that the student unsealed and tasted the product during the interaction, rather than merely dropping an unopened package into a bag.
Cost per First-Party Opt-In establishes the acquisition cost of compliant, verified digital contacts collected through on-campus mechanics:
Cost per First-Party Opt-In = Total Program Cost / Valid First-Party Opt-Ins
Every contact record included in the denominator must feature complete consumer information, age validation, and verified double opt-in consent for ongoing digital marketing communications.
Cost per Retail Action measures the direct expenditure required to stimulate an immediate physical store visit or digital purchase:
Cost per Retail Action = Total Program Cost / Attributed Retail Visits, Redemptions, or Purchases
This ratio directly links field expenditures to tangible shopper behaviors, providing commercial teams with actionable data to defend retail distribution expansion.
Tracking field labor productivity enables brand directors to identify top-performing student leaders and optimize campus staffing schedules:
Meaningful Interactions per Labor Hour = Meaningful Interactions / Total Ambassador Labor Hours
Qualified Opt-Ins per Labor Hour = Qualified First-Party Opt-Ins / Total Ambassador Labor Hours
Incremental Margin per Labor Hour = Incremental Contribution Margin / Total Ambassador Labor Hours
These labor efficiency ratios reveal whether high-volume programs achieved their numbers through exceptional field performance or simply through excessive, unoptimized staffing schedules.
Accurate program comparisons require comprehensive cost accounting that captures every direct and indirect expenditure. Many internal marketing teams calculate performance using only third-party agency invoices or student ambassador stipends, completely ignoring shipping, product write-downs, and administrative overhead. This practice creates an artificially low cost baseline that misleads executive leadership.
A rigorous full-cost architecture captures every financial input required to execute the program across four distinct expenditure categories.
Direct field costs represent variable and fixed capital spent exclusively on physical campus execution:
Product expenses encompass the complete cost of delivering physical inventory into student hands:
Technology expenditures track the digital tools required to capture data and maintain regulatory compliance:
Indirect costs account for internal organizational resources committed to program design and execution:
When allocating shared fixed investments, such as creative production or central software licenses across multiple campus deployments, teams should apply a consistent pre-campaign formula. Dividing fixed infrastructure expenses equally across participating universities or pro-rating them based on total planned field hours ensures fair cost accounting across every market.
Campus marketing programs often build long-term brand equity, favorability, and consideration long before a student walks into a grocery store. Measuring short-term retail velocity without tracking brand perception undervalues programs designed to shift consumer sentiment. Conversely, reporting positive survey responses as settled revenue distorts commercial performance.
A mature measurement framework tracks attitudinal shifts separately from physical transactions, applying structured brand-lift research methods.
Evaluating attitudinal change requires a controlled survey methodology comparing exposed students against an unexposed campus control cohort:
To isolate true brand perception changes, calculate Incremental Brand Lift:
Incremental Brand Lift = (Post-Treatment Score - Pre-Treatment Score) - (Post-Control Score - Pre-Control Score)
Campus survey instruments should measure movement across key stages of the consumer decision journey:
Data published by the Advertising Research Foundation demonstrates the importance of using structured treatment and control groups to isolate genuine campaign lift from natural baseline sales fluctuations. In their published research on campaign measurement standards, the Advertising Research Foundation highlights that failing to account for unexposed control baselines frequently causes marketing teams to overstate marketing effectiveness by double-digit percentages.
Similarly, extensive emerging media research conducted by Nielsen across more than one thousand campaign studies indicates that brand recall and baseline awareness account for over seventy-five percent of total measured brand lift. Their findings show that brand recall alone accounts for 38.7 percent of measured lift, while baseline brand awareness accounts for 37.5 percent. Measuring these foundational perception metrics allows marketers to understand why certain campuses achieve rapid retail conversion while others require sustained peer exposure before driving volume.
Research from Refuel Agency's College Explorer study further illustrates the bridge between field interactions and consumer action. Their data indicates that ninety percent of college students who engage in a meaningful dialogue with a campus brand ambassador take a subsequent brand action. Specifically, their research shows that forty-six percent of students research the product online, forty-three percent discuss the brand with friends or family, forty-six percent buy the product, and forty-two percent visit a physical retail store stocking the brand. While these survey metrics represent self-reported student actions rather than controlled point-of-sale scanner data, they confirm that high-touch peer interactions create substantial momentum through the middle and lower stages of the purchase funnel.
To examine how high-touch field programs turn peer conversations into verified retail demand, read our analysis on how product sampling campaigns bridge campus activations to retail sales for Gen Z.
The primary commercial objective of most campus consumer product activations is driving product velocity through nearby retail partners. Whether targeting off-campus convenience chains, regional grocers, or campus bookstore convenience marts, field teams must establish rigorous tracking mechanisms. Without precise tracking, commercial directors cannot prove whether an activation generated profitable store velocity.
Connecting field interactions to physical retail registers requires trackable, friction-free conversion tools:
Defining the post-event tracking window before launching operations is mandatory for objective reporting. Attribution windows must reflect the product category's natural purchase cycle:
Establishing a strict ninety-day evaluation window across extended campaigns prevents teams from claiming credit for purchases driven by later holiday promotions or national media bursts. For comprehensive frameworks on structuring post-campaign commercial reporting, review how to measure experiential marketing ROI: metrics, models, and reporting.
When students encounter campus ambassadors, view targeted social media advertisements, and see retail endcap displays within the same week, assigning total sales credit to the field team misrepresents performance. Field operators should compare single-touch and multi-touch attribution models against controlled retail scanner baselines.
If a retail store located adjacent to an activated university experiences a twenty percent velocity lift while a matched control store in a non-activated university market experiences a five percent lift, the true incremental contribution of the campus field program is fifteen percent. Utilizing contribution margin return calculations ensures that field investments are evaluated on profitable net volume:
Contribution Margin ROI = (Incremental Contribution Margin - Total Program Cost) / Total Program Cost
This financial metric strips away retailer wholesale allowances, packaging costs, and freight expenses, presenting executive leadership with the true net return on invested marketing capital.
Commercial outcomes can fluctuate due to localized factors beyond the control of field ambassadors, including adverse weather, retail partner inventory stockouts, or unexpected campus construction. Evaluating programs purely on immediate sales can lead leadership to cancel a strategically brilliant program that suffered from poor logistical execution. Conversely, it can cause them to scale a poorly targeted campaign that benefited from accidental foot traffic.
Implementing an execution audit scorecard separates field operational discipline from strategic campaign effectiveness.
Field supervisors and secret shoppers evaluate activations across ten operational categories, scoring each dimension from zero to five:
Auditors evaluate shift attendance, punctuality, uniform compliance, and ambassador team energy. Full points require zero unexcused absences and complete shift coverage throughout the scheduled operational window.
Auditors test ambassador product knowledge, ingredient recall, brand narrative accuracy, and objection-handling capabilities. Full points require unassisted articulation of key brand value propositions.
Auditors inspect footprint cleanliness, signage visibility, banner tension, structural integrity, and trash management. Full points require flawless visual alignment with national brand aesthetic guidelines.
Auditors assess line management, wait times, engagement pacing, and interaction quality. Full points require smooth queue movement without consumer congestion or rushed conversations.
Auditors review digital survey completion rates, opt-in consent compliance, device battery management, and data upload stability. Full points require complete, deduplicated contact capture without operational downtime.
Auditors evaluate stock availability, product temperature management, sampling supply organization, and waste minimization. Full points require zero midday stockouts and strict cold-chain compliance.
Auditors evaluate footprint positioning, pedestrian walkway access, student demographic fit, and permit boundary compliance. Full points require high-density target student traffic within permitted physical zones.
Auditors review how effectively ambassadors communicate retail partner locations, promotional discounts, and redemption directions. Full points require clear verbal and physical direction toward local stocking stores.
Auditors inspect structural anchoring, electrical safety, trip hazard mitigation, and local campus permit documentation. Full points require complete compliance with all university risk and safety regulations.
Auditors evaluate same-day recap submissions, photo log quality, expense documentation, and remaining inventory counts. Full points require verified, complete reporting delivered within twelve hours of shift completion.
Plotting execution audit scores against measured commercial outcomes creates a clear four-quadrant diagnostic framework for executive decision-making:
These activations represent model campus deployments. The strategy is sound, the audience targeting is precise, and the field team executed operations flawlessly. Brands should scale these programs across additional university markets with similar demographic profiles.
The field team executed operations with complete discipline, but target students failed to convert into retail buyers. Marketing leadership must reassess the core value proposition, promotional offer, pricing structure, or campus demographic selection before investing additional capital.
The activation generated strong retail pull despite severe operational breakdowns, such as stockouts, late arrivals, or broken check-in hardware. Leadership must fix field logistics, replace unreliable staffing vendors, and streamline operations to capture unrealized demand.
These deployments failed on both operational delivery and consumer conversion. Leadership should immediately discontinue the program format in that market, reallocating capital toward proven activation channels.
Executing an airtight measurement program requires rigorous preparation long before ambassadors arrive on campus. Following a disciplined operational checklist ensures consistent data collection across every stage of the campaign lifecycle.
To understand how peer networks can be structured into reliable long-term measurement assets, read our operational guide on taking the tour to campus using student ambassador programs.
Evaluating real-world operational scenarios demonstrates how applying a rigorous measurement framework prevents costly strategic missteps. The following diagnostic case patterns illustrate common measurement breakdowns and practical operational solutions.
A functional beverage brand launched an aggressive back-to-school sampling campaign across twelve university campuses. Over four weeks, field teams distributed eighty thousand cold beverage cans near high-traffic student union plazas. The agency recap celebrated a low distribution cost of seventy-five cents per sample.
However, sixty-day retail scanner data from neighboring convenience stores showed zero incremental sales lift. An operational audit revealed that ambassadors stood behind folding tables handing cold cans to students rushing to class without initiating conversations or communicating retail availability. Over thirty percent of distributed cans were discarded partially consumed, and no localized promotional incentives were provided.
The brand redesigned the program for the spring semester. They reduced total distribution targets to twenty-five thousand units, mandated sixty-second interactive product demonstrations, introduced chilled sampling cups, and distributed an exclusive buy-one-get-one coupon redeemable at local campus convenience stores. While the cost per distributed unit increased to two dollars and ten cents, local retail velocity increased by twenty-eight percent over baseline, generating a positive contribution margin ROI within forty-five days.
A premium snack brand compared two distinct campus marketing models: a high-production mobile airstream trailer footprint that toured six major state universities, and a decentralized student ambassador network across twenty smaller private colleges. The mobile tour cost four hundred thousand dollars and generated forty thousand verified visits, yielding a cost of ten dollars per attendee.
The ambassador program cost one hundred thousand dollars and engaged twelve thousand students, yielding a cost of eight dollars and thirty-three cents per engaged student. When commercial outcomes were evaluated ninety days post-campaign, the ambassador program generated four times the volume of trackable retail coupon redemptions and twice the volume of first-party SMS opt-ins.
The mobile tour generated impressive visual spectacle, but ambassadors spent most of their time managing long photo lines rather than educating students on product benefits. In contrast, the campus ambassadors integrated product sampling into dormitory study breaks, club meetings, and athletic club practices where meaningful peer conversations occurred naturally. The brand reallocated seventy percent of its experiential budget into expanding the peer ambassador network the following year.
A plant-based snack brand executed a sampling campaign across eight collegiate markets, achieving exceptional engagement depth. Post-event surveys revealed a thirty-two percent lift in aided brand awareness and a twenty-five percent increase in stated purchase intent. However, thirty-day post-activation retail scanner data showed an incremental sales lift of only two percent.
A retail execution audit revealed that the brand's primary retail grocery partner experienced an eighty-five percent stockout rate on the promoted product lines during the two weeks following the on-campus activation. Students who visited local grocery stores with promotional vouchers found empty shelves and left without purchasing.
Because the marketing team tracked execution metrics separately from consumer perception and retail outcomes, they recognized that the marketing campaign was highly effective, but supply chain coordination had failed. Rather than canceling the campus marketing program, the brand established a mandatory retail inventory verification protocol, requiring field leads to physically inspect local store shelves before launching on-campus sampling operations.
For brands planning multi-market activations that require cross-functional field logistics, review 5 key elements to high-impact activations to ensure alignment between supply chain readiness and field execution.
Implementing a structured measurement framework transforms campus marketing from an unpredictable brand awareness expense into a predictable, commercially verifiable driver of retail growth.

30 Years Experiential & Retail Activation Partner for CPG & Beverage Brands | Multi-Market Demos, Roadshows & Costco/Club Programs That Actually Sell