Robbie Thain
Founder, CEO

Structured trade show debriefs evaluate operational variance, measurement baselines, root causes, and lead conversion leaks to maximize post-event.

A structured trade show debriefing process transforms fragmented booth observations into clear commercial decisions and repeatable revenue gains. By establishing an evidence-based review across logistics, staffing, lead qualification, and downstream pipeline, marketing leaders can systematically eliminate budget waste and scale what works.
Marketers frequently search for how to conduct a trade show postmortem that actually drives business changes rather than producing another forgotten slide deck. This guide provides the complete framework, formulas, and operational templates required to turn event data into commercial momentum.
The trade show floor closes amid pure operational exhaustion. Brand ambassadors pack down displays, sales reps scramble for flights, and crates stack up along freight aisles waiting for pickup. Meanwhile, lead retrieval scanners sit in transport cases with hundreds of unverified badge taps.
A week later, marketing leadership asks a fundamental question: did the activation justify the budget? The answers are almost always conflicting and anecdotal. The field team reports high booth energy and steady foot traffic. Sales reps claim the leads were low quality, while finance notes significant invoice creep across drayage and electrical drop fees.
Without a rigorous debriefing process, teams repeat identical mistakes across subsequent calendar dates. Badge scans get dumped into a broad nurturing email blast without context. High-value retail buyers who asked detailed distribution questions receive generic product flyers. The event is labeled a success based purely on booth aesthetics, or written off as a failure without identifying where the funnel broke down.
A true postmortem treats an exhibition as a connected commercial operating system. The booth display is merely one element in a chain that spans targeting, logistics, conversations, qualification, data handoffs, and downstream sales velocity. When you evaluate the entire chain with disciplined methods, you stop relying on gut feelings and start building measurable pipeline.
An effective postmortem does not begin when the exhibit hall lights turn off. It starts weeks before freight ever leaves the warehouse by establishing explicit measurement baselines. If an organization does not document what success looks like ahead of time, it cannot accurately evaluate performance afterward.
Every activation requires an event measurement brief that defines target accounts, operational thresholds, and concrete conversion goals. Without this document, debrief meetings devolve into subjective debates where the loudest voice sets the narrative. Documenting these parameters in advance holds every department accountable to the same commercial standards.
To build a reliable evaluation model, structure objectives across three distinct tiers:
Activity metrics only matter when they connect directly to behavioral and business outcomes. Capturing 500 scans is meaningless if 80 percent of those contacts lack decision-making authority or never receive timely sales outreach.
A thorough evaluation isolates performance variables across multiple dimensions rather than aggregating results into a single average. Analyze data at the event level to determine overall viability, but also examine performance by day and by shift.
Different attendee profiles walk the floor on opening morning compared to the final afternoon. Track conversion rates across individual staff roles, visitor buyer segments, and specific product demonstration zones. This granular visibility reveals whether poor lead counts were caused by a bad show concept, weak shift coverage, or ineffective positioning.
Evaluating a major event requires an objective sequence that separates immediate field recollections from verified data. Adapting structured after-action review formats established by organizations like the World Health Organization allows teams to move from raw observation to strategic adjustment. A complete debrief occurs across four distinct operational phases.
Conduct an initial debrief within 24 to 72 hours while memories remain sharp. Keep this session focused strictly on operational observations rather than final commercial judgments.
Focus the conversation on practical field dynamics. Document which visitor questions arose constantly, where physical booth bottlenecks formed, and which demonstration scripts fell flat. Record operational friction points, such as scanner failures, inventory shortages, or slow handoffs, and assign owners to verify the underlying facts.
Between day 4 and day 14, assemble and reconcile hard operational records. Gather badge scan exports, lead qualification notes, calendar meeting logs, and staff time tracking sheets.
Collect all venue service invoices, shipping receipts, electrical drop bills, and change orders. Aligning raw attendee files with your CRM prevents staff recollections from distorting factual reality. You can review our detailed breakdown on how to turn event data into better decisions to refine your data reconciliation workflows.
Once data is validated, trace critical variances back to their foundational causes using structured techniques like the Five Whys. If qualified leads missed targets by 40 percent, avoid accepting surface-level claims like "hall traffic was slow."
Investigate the operational chain thoroughly. Was traffic truly slow, or did the booth attract the wrong attendee profile? Did staff fail to qualify visitors quickly, or did technical demonstration issues create lines that discouraged target buyers? Isolating the exact failure point prevents teams from fixing the wrong problem.
Conclude the review by translating every verified finding into a binding operational decision. Classify outcomes into five explicit actions:
Assign each decision an owner, an implementation deadline, and an explicit target metric for the next activation.
Operational issues rarely stay contained within the logistics budget. They actively degrade commercial performance by consuming staff energy and disrupting scheduled buyer meetings. A rigorous postmortem conducts a line-by-line financial and operational variance analysis.
Research from The Exhibitor Advocate shows how quickly logistics expenses can escalate. Their annual survey indicates that nationwide material-handling base rates increased 9.5 percent in 2025 to an average of $2.28 per pound. Furthermore, local rates vary drastically across regions, ranging from $1.02 per pound in Atlanta to $2.86 per pound in Philadelphia. Managing these variables requires rigorous pre-show auditing and variance tracking.
Compare advance warehouse deliveries against direct-to-show shipments to assess freight handling efficiency. Did late product shipments trigger expensive special handling surcharges on the show floor? Did crated demonstration units exceed weight limits, driving unexpected drayage costs?
Audit whether product samples and marketing materials arrived in pristine condition or suffered transit damage that delayed booth opening. For complex, multi-city event schedules, implementing centralized logistics control for trade shows helps mitigate late shipment penalties and maintain budget discipline across venues.
Review installation and dismantle labor invoices against initial service quotes. Unplanned overtime frequently points to incomplete layout drawings, missing hardware, or complex booth components that required on-site modification.
Check electrical, rigging, and dedicated internet line charges. Ordering utility drops on the show floor rather than during early-bird discount windows inflates costs significantly. Verify that vendor service level agreements were met, noting instances where late utility delivery idled booth staff.
A badge scan is merely an electronic contact capture, not a commercial lead. The central challenge in trade show evaluation is diagnosing where prospective buyers drop out between initial booth contact and final revenue realization.
According to research from the Center for Exhibition Industry Research, exhibitors that qualify leads systematically classify approximately 39 percent of their interactions as genuinely qualified. Capturing contextual notes beyond basic badge data is essential for preserving lead value. When lead qualification lacks structure, commercial yield drops dramatically across subsequent sales stages.
Track lead velocity across six core transition stages to pinpoint operational bottlenecks:
Examine each drop-off point independently. If your team captures 600 scans but only 40 convert to sales-accepted leads, expanding booth footprint next year will only multiply waste. The correct operational fix requires tightening qualification protocols on the floor.
Standardize lead scoring across five objective categories: Account Fit, Decision Authority, Commercial Need, Purchasing Timeline, and Agreed Next Action. Require staff to log these criteria directly into lead capture tools before resetting for the next visitor.
Assigning numeric weight to these dimensions prevents personal bias from skewing lead quality reporting.
Every question asked at a trade show booth represents raw commercial intelligence. When buyers ask about shelf-life parameters, minimum order volumes, or distributor pricing tiers, they reveal their decision-making criteria.
When organizations ignore these inquiries, they miss opportunities to refine brand positioning. Transforming attendee questions into concrete marketing collateral strengthens subsequent field campaigns.
Log and classify all visitor interactions into functional business categories during the postmortem:
Count the frequency of each question category and cross-reference it against attendee job titles. If multiple retail category managers ask whether your packaging fits standard shelf heights, your physical display is failing to communicate key operational details.
Establish an operational pipeline that maps recurring questions directly to newly created collateral. If retail buyers routinely ask about velocity data, produce a verified sell-through case study before the next show cycle.
Update booth graphics, digital presentation decks, and staff training scripts to address common objections before visitors even step onto the carpet. You can reference our resource on how to turn trade shows into a reliable source of market intelligence to structure these data loops across internal teams.
Booth performance relies heavily on human execution. A great conceptual booth staffed by unprepared, unmotivated personnel will fail to deliver commercial results.
Surveys from EXHIBITOR indicate that while CRM adoption reached 75 percent, the share of exhibitors training staff on lead qualification protocols fell to 55 percent. Evaluating booth personnel requires objective, role-specific metrics rather than blanket sales targets.
Evaluate team members based strictly on the behaviors and workflows they control directly on the floor:
Separating these functions prevents teams from blaming front-line greeters for slow pipeline conversion when account executives fail to complete post-show outreach. For deeper guidance on building balanced field rosters, review our guide on aligning event labor to turn foot traffic into a sales pipeline.
Distribute an individual post-event survey to booth staff before conducting group meetings. Collecting feedback independently ensures senior executives do not inadvertently suppress candid observations from field personnel.
Ask staff which customer profiles were most receptive, which product messages resonated, and where handoffs failed during peak traffic surges. Distinguish between individual underperformance and underlying system failures. If multiple team members fail to capture buyer phone numbers, the digital intake form is too cumbersome for a busy show environment.
Proving commercial Return on Investment (ROI) requires moving beyond basic cost-per-badge-scan metrics. Trade show activations operate across long buying cycles involving multiple touchpoints across sales, digital marketing, and field events.
Industry data from Freeman highlights the commercial power of in-person interactions. Their research shows that 84 percent of attendees consider conversations with subject-matter experts crucial, while 74 percent view live events as the premier channel for product discovery. Furthermore, 96 percent of respondents state that touching or testing a product increases their advocacy confidence. Measuring these qualitative advantages requires robust financial attribution models.
Calculate unit economics systematically to compare show performance against alternate go-to-market channels:
Tracking these financial indicators prevents marketing leaders from confusing gross activity volume with commercial profitability.
Categorize pipeline value across four distinct commercial attribution lanes:
Applying these attribution lenses ensures field activations receive accurate credit for supporting enterprise accounts throughout extended sales cycles. You can learn more by exploring our resource on five metrics to prove trade show return on investment.
A postmortem only delivers value when it alters subsequent execution. Structuring a clear follow-up workflow ensures insights translate directly into operational and commercial gains.
Research from EXHIBITOR indicates that while 49 percent of organizations track leads through the sales cycle, only 22 percent respond to trade show leads within 24 to 48 hours. Establishing an automated, disciplined handoff protocol directly bridges this gap.
Follow this sequential playbook across every trade show debrief:
Maintaining this operational cadence ensures marketing teams continuously optimize budgets and improve lead velocity.
A national snack food brand launched an updated product line targeting regional grocery chains and specialty retail distributors. While early consumer trial in test markets showed strong demand, the brand struggled to convert broad trade show excitement into concrete shelf placements.
At major industry expos, their booth was consistently crowded with attendees sampling snacks, yet post-show wholesale order volume lagged expectations. The marketing leadership initiated an exhaustive postmortem framework to identify where the commercial disconnect occurred.
Our team conducted a comprehensive operational audit across their trade show footprint. The data revealed that their open sampling layout attracted heavy consumer foot traffic, overwhelming staff and preventing them from identifying verified retail category managers. In our experience, high foot traffic can easily mask weak commercial qualification if floor staff lack structured engagement boundaries.
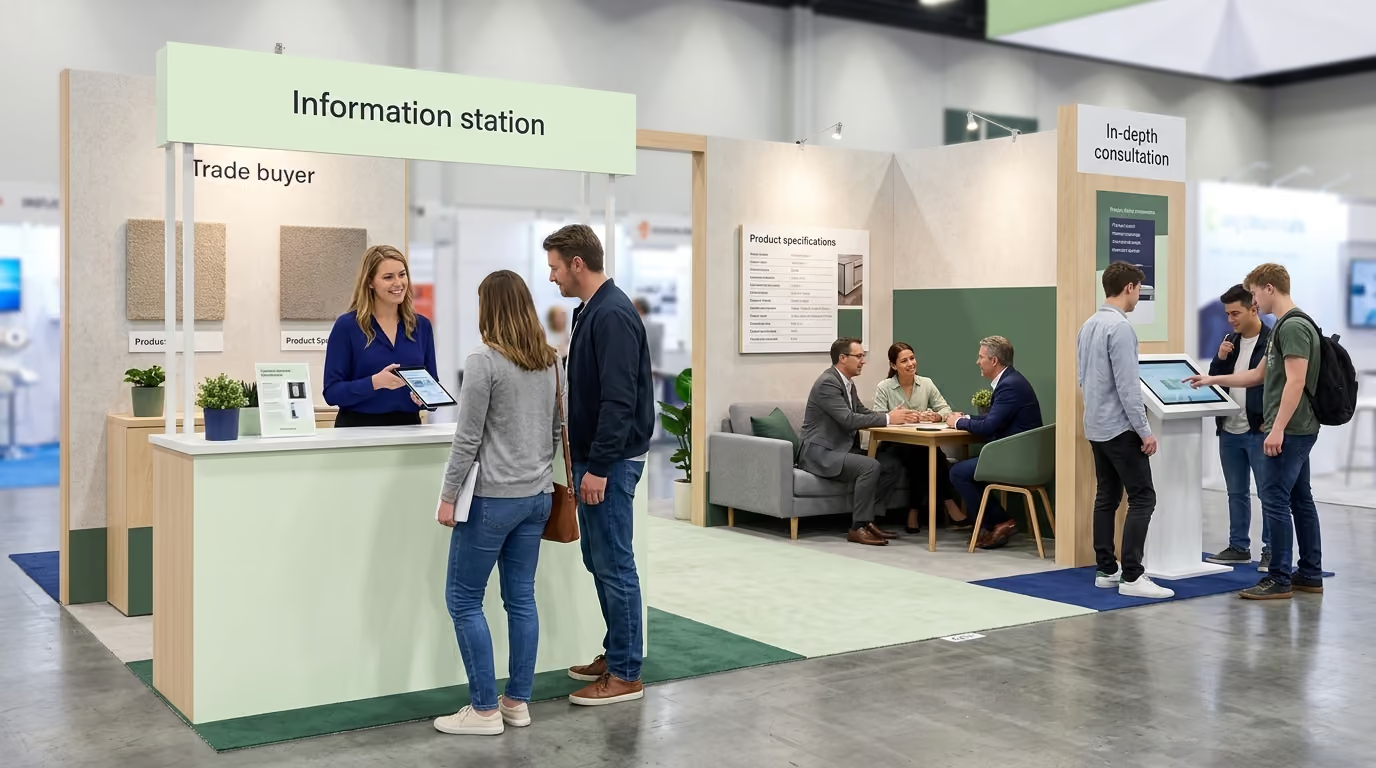
The brand redesigned its physical booth architecture for subsequent expos. They established an exterior sampling counter for quick tastings, while reserving an interior meeting lounge exclusively for credentialed retail buyers and category managers. Furthermore, they streamlined their digital intake workflow, requiring staff to log current store counts, primary distributors, and shelf-review timing for every wholesale inquiry.
A Director of Brand Strategy in the CPG snack division shared: 'The Makai team turned our product launch into a sensory event that shoppers still talk about. From creative storytelling to flawless in-store execution, they made snack time unforgettable. We couldn't have asked for a stronger partner.' Our team created an in-store experience that left a lasting impression on consumers and became a memorable brand moment.
The commercial impact was immediate and measurable across subsequent quarters. While gross badge scans decreased by 18 percent, sales-accepted retail buyer leads increased by 142 percent. The cost per qualified lead dropped by 44 percent, and the brand secured new regional distribution across 1,200 retail doors within four months. For additional strategies on scaling product sampling into measurable commercial pipelines, explore our guide on turning trade show sampling into retail pipeline velocity.
Transforming your debriefing process begins with concrete operational adjustments. Review this action checklist to upgrade your postmortem workflows this week:
Applying this level of rigor ensures that every dollar, hour, and conversation invested on the trade show floor directly strengthens your commercial engine.

30 Years Experiential & Retail Activation Partner for CPG & Beverage Brands | Multi-Market Demos, Roadshows & Costco/Club Programs That Actually Sell