Robbie Thain
Founder, CEO

Four distinct KPI tiers and rigorous control architectures enable retail brands to isolate true incremental sales from subsidized base volume effectively.

Most retail activation reports celebrate sales spikes that would have happened anyway while ignoring the long-term customer acquisition that actually justified the budget. Measuring real commercial lift requires a structured experimental framework built prior to launch rather than after the receipts are printed.
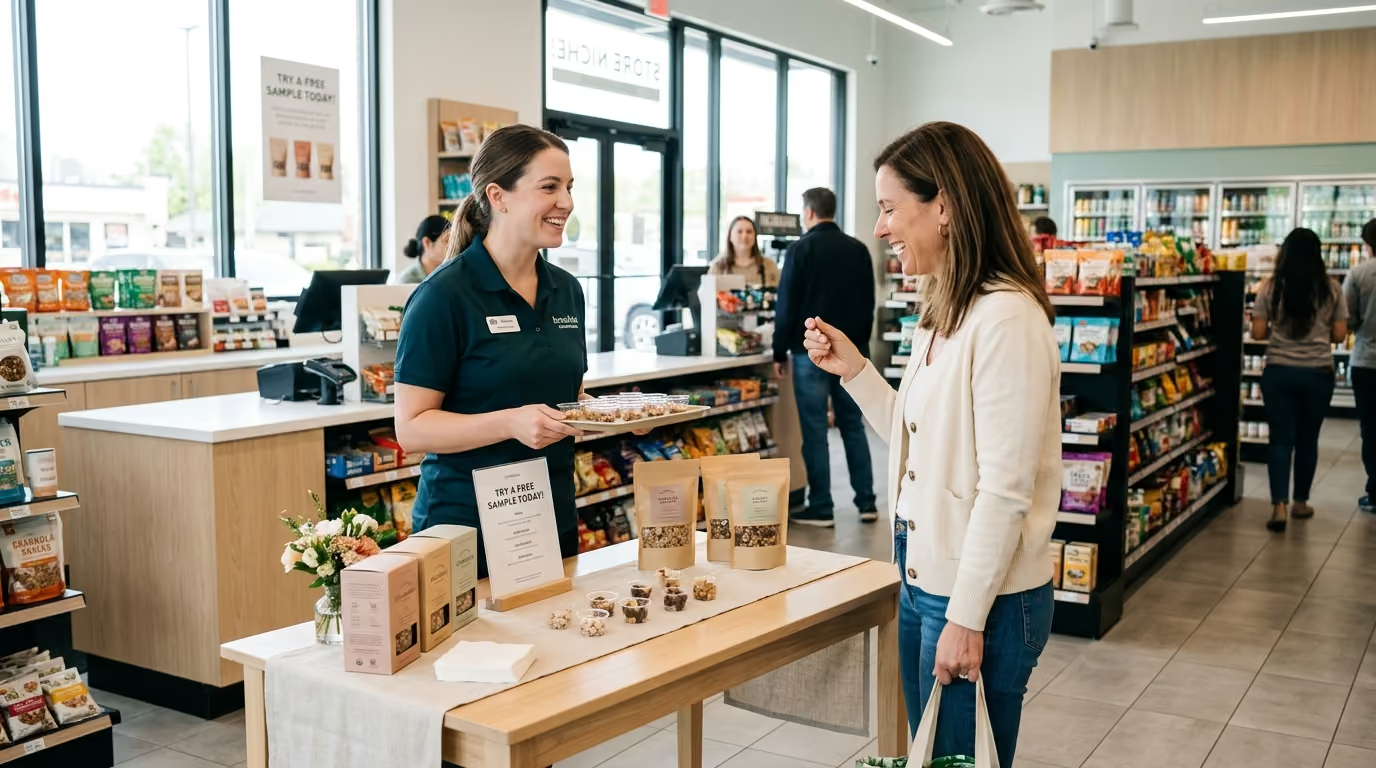
Every Saturday afternoon, grocery and club store aisles turn into chaotic battlegrounds for consumer attention. Brand ambassadors scramble with portable induction burners, display tables, and branded banners while competing for power outlets and floor space. Meanwhile, shoppers grab product samples and drop items into their carts amidst screaming children and congested aisles. Back at corporate headquarters, marketing directors look at Monday point-of-sale reports, wondering whether that sudden surge in unit movement was profitable customer acquisition or subsidized volume for existing brand loyalists.
Without an upfront measurement plan, field execution becomes an expensive guessing game. Brands routinely mistake operational activity for commercial impact. To prove Return on Investment (ROI) and secure long-term retail distribution, brand teams must replace retrospective guesswork with systematic, pre-launch measurement architecture.
The primary question behind any retail marketing investment is direct and unforgiving. What commercial outcome happened because of the activation that would not have happened without it?
Answering this question requires isolating incrementality. NielsenIQ defines incrementality as the sales or commercial value generated that would not have occurred without the specific promotional spend or field marketing effort. Total register sales during an in-store demonstration do not equal activation success. Gross volume includes base volume, which represents the purchases shoppers would have made regardless of whether an ambassador was present in the aisle.
When a brand runs a promotion or sampling event, observed volume splits into distinct financial categories:
Calculating raw unit lift without accounting for these distinctions distorts brand economics. For instance, if an artisan snack brand sells 400 units during a four-hour weekend activation against a typical baseline of 100 units, the unadjusted gross lift appears to be 300 units. If loyalty card data reveals that 180 of those buyers purchase the brand every month, those 180 units represent subsidized sales rather than true growth.
Failing to separate base velocity from incremental movement leads to negative financial returns. Promotional lift can turn negative when the additional volume generated fails to cover the combined cost of labor, product waste, slotting allowances, and temporary price reductions. Understanding these dynamics requires a firm grasp of retail product sampling KPIs and measurement metrics to evaluate true commercial contribution.
Vague strategic intentions guarantee ambiguous post-campaign reporting. Goals like driving category excitement or creating brand awareness are impossible to validate against sales records. Every retail activation must start with a measurable commercial hypothesis that dictates test structure, data collection, and financial analysis.
A rigorous measurement objective must define five structural elements:
Consider the difference between two common project mandates. A weak objective states: "Execute fifty weekend sampling events across high-volume grocery locations to drive product trial and brand visibility."
A robust objective states: "Determine whether staffed weekend sampling in fifty Tier-1 retail accounts generates a minimum of fifteen percent incremental unit lift over a four-week post-event window compared to fifty matched non-activated stores, achieving a cost per incremental buyer below twelve dollars."
The second objective guides exact staffing protocols, data collection timetables, control store selection, and economic evaluation standards. When objectives are defined with this level of rigor, evaluating whether to partner with external specialists becomes straightforward. Brands seeking structured execution models often consult the brand guide to selecting a retail activation partner to match agency analytical capabilities with their internal reporting requirements.
Field marketing campaigns produce hundreds of data points, from staff arrival timestamps to register scan logs. Without a defined hierarchy, teams drown in trivial execution details while missing core commercial trends. A balanced measurement framework structures metrics across four distinct operational tiers.
These metrics evaluate overall financial performance and justify program spend to executive leadership:
These indicators explain why the business outcome occurred by tracking consumer behavioral changes at the shelf:
These operational indicators confirm whether the campaign occurred as planned, preventing teams from mistaking poor field execution for poor product appeal:
These metrics guide ongoing budget optimization, helping marketing operators reallocate spend toward the highest-performing markets and retail banners:
Execution metrics must never be substituted for business outcome metrics. A field team can distribute 500 samples in an afternoon and achieve a perfect compliance score. If those interactions do not generate incremental purchases, the activation failed commercially.
The foundation of any incrementality measurement plan is the counterfactual baseline. You cannot prove what your activation generated without establishing what would have occurred had your team stayed home. Several analytical methods exist to establish this baseline, each carrying specific advantages and statistical trade-offs.
The simplest method calculates an average baseline from the target stores during prior comparable trading weeks. While easy to calculate, historical averages are vulnerable to seasonal shifts, weather anomalies, price changes, and shifting macroeconomic factors.
If you compare a July sampling campaign against June baseline data, summer foot traffic differences will distort your incremental calculation. Historical baselines are best reserved for short-term operational monitoring rather than final financial reporting.
Matched-store designs represent an accessible and robust standard for physical retail testing. In this approach, brand teams identify a group of control stores that share core operating characteristics with the treatment stores receiving the activation. Matching criteria should include:
By comparing the performance of treatment stores against matched control stores during the identical calendar window, teams strip out the confounding effects of holidays, weather, and general market swings.
Difference-in-differences modeling combines historical tracking with matched control groups to isolate causal impact. The calculation measures the change in performance within treatment stores from the pre-period to the post-period, then subtracts the corresponding change observed across control stores over the exact same period.
$$\text{Incremental Lift} = (\text{Post}_T - \text{Pre}_T) - (\text{Post}_C - \text{Pre}_C)$$
Where:
This calculation eliminates time-invariant structural differences between store groups. It also removes macro market trends that affected the entire retail chain during the campaign window.
Sophisticated brand analytics teams employ regression models that ingest multiple retail variables simultaneously. These models incorporate baseline velocity, promotional pricing status, out-of-stock logs, local advertising spend, and regional economic data.
NielsenIQ and leading academic researchers utilize these multivariate models to separate baseline volume from promotional lift across large retail datasets. When managing complex national campaigns, building a structured system modeled after the complete guide to field marketing measurement plans ensures that statistical modeling accounts for every operational variable.
Proving causality requires structured experimental design. The way you assign retail stores, geographic markets, and promotional tactics determines whether your post-campaign data yields actionable insights or confusing noise.
The gold standard of commercial field testing is the randomized factorial trial. In this structure, eligible retail stores within a defined market are randomly assigned to distinct promotional cells:
Factorial designs isolate the precise sales lift generated by human brand ambassadors versus passive secondary product placement. They also reveal whether combining both tactics creates compounding sales velocity or diminishing financial returns.
When retail activations are supported by local media, store-level randomization often suffers from marketing spillover. A digital ad delivered to a smartphone cannot be strictly contained to shoppers visiting Store A while excluding those visiting Store B two miles away. In these scenarios, geographic holdouts provide a cleaner experimental structure.
Google's Conversion Lift methodology utilizes geographic testing by splitting comparable Designated Market Areas (DMAs) or metropolitan clusters into exposed and holdout groups. Treatment markets receive coordinated retail media, local digital ads, and in-store sampling events, while holdout markets maintain business-as-usual operations. Comparing aggregate market-level point-of-sale data across both clusters provides a reliable read on full-funnel activation impact.
A frequent error in retail activation measurement is evaluating performance solely during active event hours. High-impact field activations alter consumer buying habits long after the demonstration table is folded away.
Research published in the Journal of Retailing by Chandukala, Dotson, and Liu analyzed six scanner datasets across multiple grocery categories. The authors established that in-store sampling produces both substantial immediate lift and sustained post-event sales effects. Secondary academic reporting on the study revealed that sampled products often maintain elevated sales velocity for two to eight weeks post-activation.
The study highlighted three critical operational findings:
To capture the true value of an activation, measurement architectures must evaluate performance across three distinct time windows:
Accurate retail measurement requires breaking down data silos. Point-of-sale numbers tell you what was scanned at the checkout, but they cannot explain why a particular store underperformed. A unified data model blends operational field logs, retailer inventory feeds, and consumer loyalty records into a single analytical pipeline.
Point-of-sale (POS) data is the operational anchor of retail analytics. Modern retail measurement frameworks ingest weekly or daily store-level scanner feeds capturing total unit volume, gross revenue, net realized selling price, promotion codes, and coupon redemptions. POS feeds provide the ground-truth transaction record necessary to measure baseline deviations across treatment and control groups.
POS data is meaningless without verified execution timestamps. A measurement plan must capture granular field data through digital reporting applications:
NielsenIQ's enriched-events methodology highlights the necessity of distinguishing planned events from verified execution. If an agency books fifty sampling dates but field staff fails to show up at eight locations, treating all fifty stores as an active treatment group skews your data. Separating planned, executed, and verified activations prevents execution failures from being misdiagnosed as marketing failures.
Stockouts represent the hidden killer of retail activation ROI. A high-energy sampling activation can generate tremendous shopper demand that goes unfulfilled if the store runs out of inventory during the second hour of the event.
Your measurement architecture must ingest daily store-level on-hand inventory balances, out-of-stock flags, and warehouse replenishment schedules. When evaluating campaign results, stores that experienced on-shelf stockouts must be isolated in the analytical report. Blending out-of-stock locations with fully stocked stores artificially depresses calculated lift and conceals genuine consumer demand. For brands running large-scale campaigns, operational protocols from the complete guide to retail product sampling programs show how to coordinate inventory buffers with retail store managers.
Retailer loyalty card programs provide household-level purchasing telemetry that raw POS register tapes cannot deliver. Ingesting loyalty data allows analytics teams to answer essential commercial questions:
Loyalty analytics allow brands to calculate lifetime customer value, transforming single-day field activations into predictable acquisition funnels.
Modern retail activations rarely operate in isolation. In-store demonstrations are frequently supported by retailer media network ads, sponsored search placements, and geo-targeted social campaigns.
NielsenIQ notes that true incrementality cannot be determined from media metrics alone. It requires unifying digital ad impressions, search rank, and digital shelf metrics with real-world store conditions like price and on-shelf distribution. Merging digital retail media with in-store execution feeds ensures proper cross-channel attribution. Marketing teams tracking these integrated campaigns often reference tools like the Albertsons retail media incrementality measurement platform to understand how digital media interacts with physical store velocity.
A successful retail measurement program requires disciplined operational execution before, during, and after the campaign. Follow this step-by-step checklist to maintain statistical validity and data integrity throughout the campaign lifecycle.
Calculating true retail activation Return on Investment requires translating incremental unit lift into net commercial profit. Gross revenue gains mean little if the operational cost of delivering the activation exceeds the margin generated by the additional volume.
The financial evaluation begins by calculating Net Realized Incremental Revenue:
$$\text{Incremental Revenue} = \text{Incremental Units} \times \text{Net Realized Wholesale Price}$$
Net realized wholesale price represents the invoice price paid by the retailer minus temporary price reductions, scan-back allowances, and promotional funding.
Next, determine Incremental Gross Profit by accounting for product cost of goods:
$$\text{Incremental Profit} = \text{Incremental Revenue} - \text{COGS} - \text{Total Activation Costs}$$
Total activation costs must capture every direct and indirect operational expense:
If an activation produces 5,000 incremental units with a net wholesale margin of $2.00 per unit, the campaign generates $10,000 in gross incremental margin. If total field execution and sampling product expenses totaled $14,000, the activation produced an immediate net loss of $4,000 during the active promotional period.
However, the financial evaluation must not end on event day. If household panel data proves that those 5,000 incremental units generated 1,200 new brand-buying households who purchase an average of six units over the subsequent 52 weeks, the long-term economics shift dramatically:
Accounting for long-term customer acquisition transforms how brand leaders evaluate activation budgets. Operations that appear marginally unprofitable on a single-day register scan become highly lucrative customer acquisition channels when evaluated across a 12-month horizon. To dive deeper into roadshow and live event logistics that protect these unit economics, review the complete guide to retail roadshows and in-store demonstrations.
Applying a measurement framework across distinct retail environments reveals nuances that aggregate averages obscure. Reviewing real-world case patterns illustrates how structured measurement separates successful retail programs from unprofitable field spend.
A premium plant-based beverage brand sought to determine whether paying for staffed weekend demonstrations was more profitable than buying unstaffed end-cap display placement across 120 regional grocery stores.
The brand structured a randomized factorial trial across four 30-store cells:
The 6-week post-campaign analysis revealed distinct commercial outcomes across each cell:
The measurement plan proved that active product trial, not passive shelf display, drove sustainable customer acquisition and long-term retail velocity.
An established snack manufacturer launched a new organic, high-protein line extension. The field marketing team executed a 50-store demonstration tour across a national club store chain. Raw register tapes showed phenomenal success, with the new SKU selling 350 units per club over the activation weekend.
However, a comprehensive measurement model tracked the broader brand portfolio and category context:
Because the new organic SKU carried a higher wholesale margin ($3.20 per unit) than the legacy SKU ($1.80 per unit), the brand successfully traded existing shoppers up to a more profitable product tier.
Had the brand only tracked the new SKU in isolation, they would have overstated incremental volume by 169 percent. By measuring portfolio cross-elasticity, the brand accurately reported net revenue lift while optimizing future production schedules for the core SKU.
Retail measurement plans frequently collapse under flawed statistical assumptions and distorted reporting practices. Protecting the credibility of your marketing data requires avoiding several common traps.
A robust measurement architecture must deliver actionable data to the right stakeholders at the right operational frequency. Structure your reporting lifecycle into three distinct phases.
Designed for field managers and agency coordinators, this dashboard focuses entirely on execution integrity:
Designed for brand managers and retail sales leads, this weekly report evaluates mid-campaign velocity:
Designed for the Chief Marketing Officer, VP of Sales, and finance leadership, this final report delivers the definitive commercial verdict:
We have been connecting brands with people through live experiences, retail programs, and national activations since 1995. In our experience over three decades of field execution, brands that establish rigorous, pre-launch measurement architectures consistently secure greater retail distribution, command larger trade budgets, and scale their physical footprint with predictable profitability.
Rigorous pre-launch measurement turns chaotic field activations into predictable engines for retail growth.

30 Years Experiential & Retail Activation Partner for CPG & Beverage Brands | Multi-Market Demos, Roadshows & Costco/Club Programs That Actually Sell