Robbie Thain
Founder, CEO

High-performing mobile activations maximize brand reach and retail conversions by evaluating audience fit, dwell time, operational feasibility.

A high-performing mobile activation treats physical geography as a testable marketing variable rather than a static backdrop. By evaluating audience fit, dwell time, purchase proximity, and operational safety, brand teams can systematically find locations that generate measurable sales velocity and brand loyalty.
A custom branded vehicle pulls up to a crowded downtown intersection at eight in the morning. Thousands of pedestrians stream past the footprint every ten minutes. The brand ambassadors open the service windows, set out display trays, and prepare to hand out cold beverage samples. Within thirty minutes, reality sets in. Commuters are walking at a brisk four miles per hour with headphones in, holding briefcases or coffee cups, focused entirely on catching their train. The team hands out only forty samples in two hours, while local transit officers threaten fines because the queue encroaches on a pedestrian crosswalk. Two miles away outside a regional grocery store, an identical team with the same inventory parks in a designated stall, interacts with relaxed shoppers walking into the store, and distributes three hundred samples an hour while driving a measurable forty percent sales lift inside the retail aisle.
Gross foot traffic is one of the most misleading metrics in experiential marketing. Brand teams often spend significant portions of their activation budgets securing prime real estate based purely on estimated pedestrian volume. When the activation goes live, they discover that high density often correlates with low attention, strict municipal enforcement, and zero conversion intent. Field marketing leaders face constant pressure to deliver measurable pipeline, retail sell-through, and verifiable consumer engagement. Achieving these outcomes requires a systematic method for evaluating, testing, and optimizing activation sites across every market.
Choosing where to place a mobile footprint requires balancing audience reach with operational feasibility. When an activation fails, it rarely fails because the product was unappealing. It fails because the physical environment prevented the team from executing the interaction.
A reliable way to calculate the potential value of any activation site is through a standardized mathematical relationship.
Location Quality equals Audience Fit multiplied by Attention Opportunity multiplied by Conversion Proximity multiplied by Visibility multiplied by Operational Feasibility minus Risk and Friction.
The multiplicative nature of this formula is intentional. If any single core variable drops to zero, the entire location value drops to zero. A site with a massive audience of the exact target demographic will produce nothing if pedestrian movement prevents people from stopping. A location with exceptional dwell time and zero municipal friction will fail if the nearest retail partner stocking the product is thirty miles away.
Field teams operate across three distinct operational formats, each requiring a different location selection strategy.
The brand establishes a temporary presence in a fixed location for several days or weeks. Common venues include shopping center plazas, lifestyle centers, transit concourses, and state fairs. These sites offer reliable power, predictable foot traffic, and high production value. They require higher rental fees, lengthy permit lead times, and long-term commitments that eliminate real-time adaptation.
The activation team visits a sequence of pre-scheduled, permitted locations throughout a market, spending anywhere from four hours to a full day at each stop. Examples include parking lot takeovers at retail partner accounts, corporate office park lunches, community sports complexes, and sponsored festival perimeters. This format balances operational control with geographical flexibility, allowing brands to compare different venue types using consistent staffing and assets.
The team utilizes nimble assets such as branded cargo bikes, utility vehicles, or backpack sampling units to move continuously across a defined geographic zone. Roaming teams operate in open public rights-of-way, beachfront boardwalks, entertainment districts, and university perimeters. This model maximizes spontaneous engagement and street-level visibility. It requires strict adherence to local solicitation ordinances, tight inventory replenishment routes, and rigorous monitoring of staff fatigue.
Systematic location selection relies on seven objective operational variables. Every candidate venue must be evaluated against these criteria before committing capital, booking staff, or scheduling routing logistics.
Audience fit measures whether the people physically present at the site match the campaign target profile in demographic makeup, lifestyle context, and category need. A location must satisfy three distinct layers of audience qualification:
Dwell time is the duration a consumer remains within the sensory zone of the activation. The Media Rating Council defines dwell time as the elapsed time from the start of a consumer visit to the final recorded activity associated with that visit. For field operations, raw dwell time must be refined into effective dwell time.
Effective dwell time represents the minutes or seconds where a consumer is both physically present and reachable by a brand ambassador. A person seated on a park bench represents high effective dwell time. A commuter standing inside a packed subway car represents high raw dwell time but zero reachable opportunity for a street-level brand team.
Brand teams must match their interaction complexity to the available attention window:
When planning multi-market routes, planning an end-to-end mobile sampling tour requires mapping consumer attention windows against the specific narrative goals of the product.
Purchase proximity defines the physical, digital, and temporal distance between the moment of trial and the point of commercial transaction. Consumer interest decays rapidly after a live interaction. The shorter the path to purchase, the higher the measurable campaign Return on Investment (ROI).
Locations fall into four distinct purchase proximity tiers:
A mobile vehicle or street footprint must be instantly identifiable from a distance. The Interactive Advertising Bureau establishes that impressions in out-of-home environments are valid only when the asset is viewable within an unobstructed exposure zone. This same rule governs physical activations.
When evaluating a physical site, audit the sightlines from fifty, one hundred, and two hundred feet away. Obstructions such as low-hanging tree canopies, construction scaffolding, transit shelters, parked delivery trucks, and competitor signage can render a massive vehicle invisible until a pedestrian is directly on top of it. The brand asset must be oriented perpendicular to the dominant pedestrian flow to maximize reading time.
Interceptability is the ease with which staff can engage pedestrians without causing physical discomfort, bottlenecking, or safety hazards. High-traffic choke points often create low interceptability because stopping a consumer disrupts the entire pedestrian corridor.
The ideal activation placement sits immediately adjacent to natural flow transitions. Look for wide sidewalk expansions, plaza perimeter edges, post-checkout retail zones, and outdoor waiting areas. These spaces allow interested consumers to step out of the main walking current without blocking others.
Staff should always be positioned on the periphery of movement, inviting consumers inward toward the asset. The Occupational Safety and Health Administration (OSHA) emphasizes in its crowd management guidelines that event layouts must maintain clear, unobstructed paths of travel to prevent crushing hazards and ensure safe pedestrian movement.
Every square foot of real estate in an urban market belongs to a specific public or private entity. Operating without verifiable, documented permission risks immediate shutdown by law enforcement, heavy municipal fines, and severe brand reputational damage.
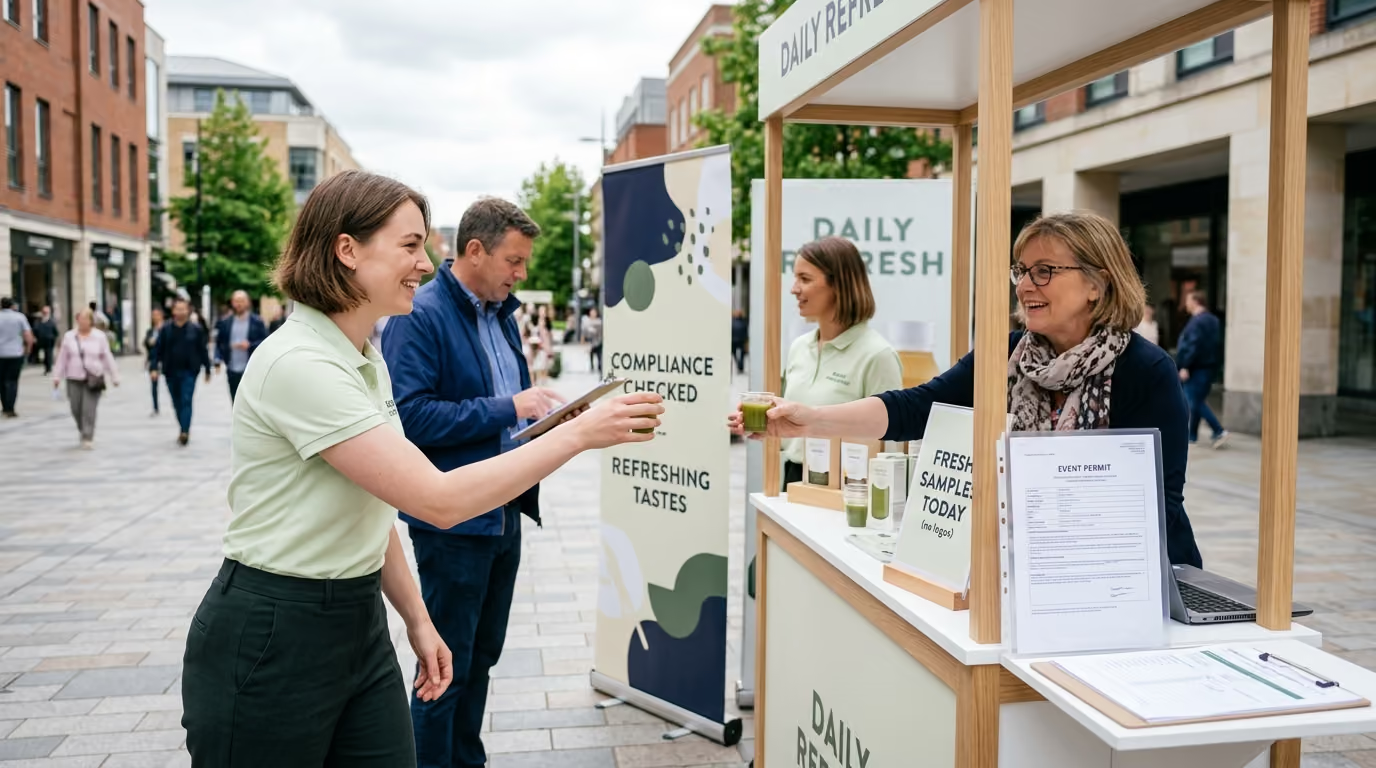
Teams must determine whether a candidate site sits on public right-of-way, municipal parkland, transit authority property, or private commercial real estate. Public spaces typically require street-use permits, special event licenses, Department of Health sampling approvals, and certificates of insurance naming local government bodies as additional insureds. Private commercial spaces require formal property owner agreements, certificate of insurance verification, and alignment with building management rules.
Small operational scale does not exempt a brand from compliance standards. The U.S. Department of Justice mandates that the Americans with Disabilities Act (ADA) applies to temporary events, public-facing brand installations, and mobile structures. Field teams must guarantee accessible routes, step-free access, appropriate counter heights, and unobstructed pathways regardless of activation duration. Navigating these requirements demands strict operational protocols, as detailed in our guide to securing municipal permits and managing compliance.
A visually stunning location is useless if the mobile asset cannot legally enter, park, operate, and replenish inventory. The field team must evaluate the mechanical and logistical realities of the site during the site selection process.
Key operational feasibility checks include:
Mobility allows brand teams to test geographical markets like digital ad channels. Instead of guessing where the ideal customer gathers, field directors can run structured location experiments across a campaign tour.
Every location test must begin with a clear, falsifiable hypothesis. A standard hypothesis states the audience segment, the venue type, the operating time window, and the behavioral outcome.
For example, a healthy beverage brand might formulate this hypothesis: "Office workers in midtown commercial plazas during the twelve to two lunch window have higher conversion rates than commuter audiences at morning transit stations because lunch pedestrians have thirty percent more dwell time and are walking directly into partner convenience stores."
This hypothesis establishes clear parameters for what to measure and what conditions determine success.
Do not waste time scoring locations that fail fundamental operational requirements. Establish non-negotiable hard gates that immediately disqualify a venue:
Once a site passes the hard gates, evaluate it using a weighted scoring model on a scale of one to five.
Audience Fit (Suggested Weight: 25%)
Are qualified target consumers present in high concentrations during operating hours? Score five for pure target audience concentration and one for mismatched general traffic.
Effective Dwell Time (Suggested Weight: 20%)
Does the pedestrian flow allow for natural, unhurried interactions? Score five for seated or lingering crowds and one for high-speed commuter transit.
Purchase Proximity (Suggested Weight: 20%)
How close is the nearest verified retail partner carrying the product? Score five for on-site or adjacent retail and one for no retail presence within five miles.
Operational Feasibility (Suggested Weight: 15%)
Can the crew set up, power, operate, and break down the footprint without friction? Score five for dedicated shore power, flat asphalt, and easy load-in, and one for complex, restricted setups.
Visibility and Sightlines (Suggested Weight: 10%)
Can approaching consumers clearly identify the brand from fifty feet away? Score five for unobstructed line of sight and one for hidden, crowded corners.
Safety and Compliance (Suggested Weight: 10%)
Does the site offer a safe operating environment with zero pedestrian-vehicle conflicts? Score five for pedestrian-only plazas with full security and one for hazardous street curbs.
A raw scorecard rating is only as good as the underlying data. Assign a confidence rating to every score:
Calculate the adjusted score by applying a penalty for uncertainty: Adjusted Score equals Raw Score minus Uncertainty Penalty minus Operational Friction Cost. Never commit significant tour capital to a high-scoring, low-confidence location without executing a controlled pilot test first.
Desktop research and demographic maps can never replace physical boots on the ground. A field reconnaissance audit uncovers micro-environmental factors that make or break an activation.
Different physical environments present unique trade-offs. Successful field operators match their brand objectives to the distinct operational realities of each location category.
Transit hubs deliver massive gross foot traffic and repeated commuter exposures. Commuters operate under intense time pressure and adhere to strict personal schedules.
These sites work best for rapid product distribution, packaged breakfast samples, and broad awareness campaigns. They fail for detailed educational dialogues, lead generation forms, or complex demonstrations. Teams must secure explicit transit authority approvals, maintain open lanes around station entrances, and avoid obstructing turnstiles or stairwells.
Campuses concentrate young adult demographics, offer vibrant social dynamics, and foster rapid peer-to-peer sharing.
Navigating campus administration is notoriously complex. Approvals often require coordination across student affairs, campus dining contractors, facility management, and university police. Furthermore, academic calendars create sharp swings in population density, making midterm and final exam weeks poor choices for brand activations. Focus operations on student union perimeters, athletic recreation centers, and off-campus commercial strips.
Operating directly in front of a retail partner provides unmatched purchase proximity. The consumer receives a chilled beverage or snack sample and can purchase a multi-pack sixty seconds later inside the store.
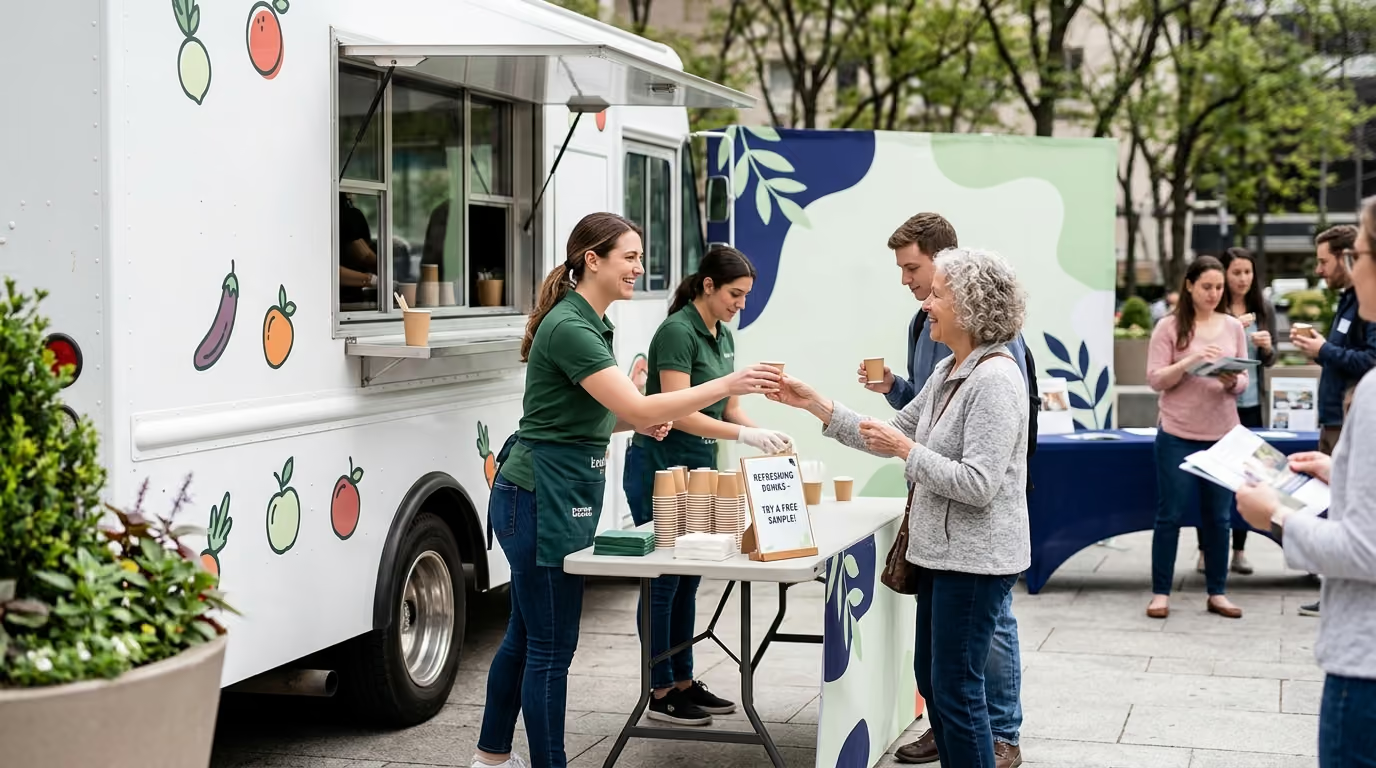
The primary risk involves customer annoyance and property management friction. Plazas frequently have strict rules regarding commercial solicitation, exterior sound amplification, and parking space absorption. When executing these programs, matching physical retail environments with consumer intent ensures the activation directly supports store-level sales velocity without causing parking congestion.
Public parks and urban plazas offer relaxed audiences, extended dwell times, and open sightlines. Consumers visit these spaces for leisure, creating high psychological availability for meaningful brand conversations.
These spaces require extensive municipal permitting through local parks departments. Vehicles are rarely permitted directly on turf or paved pedestrian plazas without special load-in escorts and protective ground coverings. Commercial sales are often prohibited on public parkland, restricting the activation to trial, education, and digital coupon distribution.
Office districts offer highly predictable lunch crowds composed of professionals with high disposable income. Foot traffic surges dramatically between eleven-thirty and one-thirty on Tuesdays, Wednesdays, and Thursdays, followed by quiet afternoons and vacant weekends.
Operating within office parks requires private landlord authorization. Outdoor footprints must handle sudden, massive lunch rushes without allowing queues to back up into building lobbies or private roadways.
Major public events draw highly energized, emotionally engaged crowds seeking entertainment. Brand teams can intercept thousands of relevant consumers within a concentrated window.
Official on-site festival sponsorships carry exorbitant rights fees and strict operational boundaries. Many brands utilize adjacent private property takeovers, parking outside the official event perimeter to engage attendees walking to and from the gates. Teams must operate strictly within their permitted private boundaries to avoid cease-and-desist actions or trademark disputes with official event organizers.
Experienced field directors avoid the standard operational traps that undermine novice experiential programs.
The most common field error is prioritizing sheer crowd volume over audience qualification. A packed tourist boulevard filled with out-of-town visitors is useless for a regional CPG brand trying to build velocity inside local supermarket chains. Target relevant, available foot traffic rather than raw pedestrian counts.
Parking a sampling trailer fifty yards from a major grocery store does not automatically drive shelf pull. If the retail store is out of stock, if store staff do not know where the product is merchandised, or if the product is hidden on a bottom shelf, the activation will fail to produce measurable sales. Field managers must audit retail inventory levels before launching an on-site sampling run.
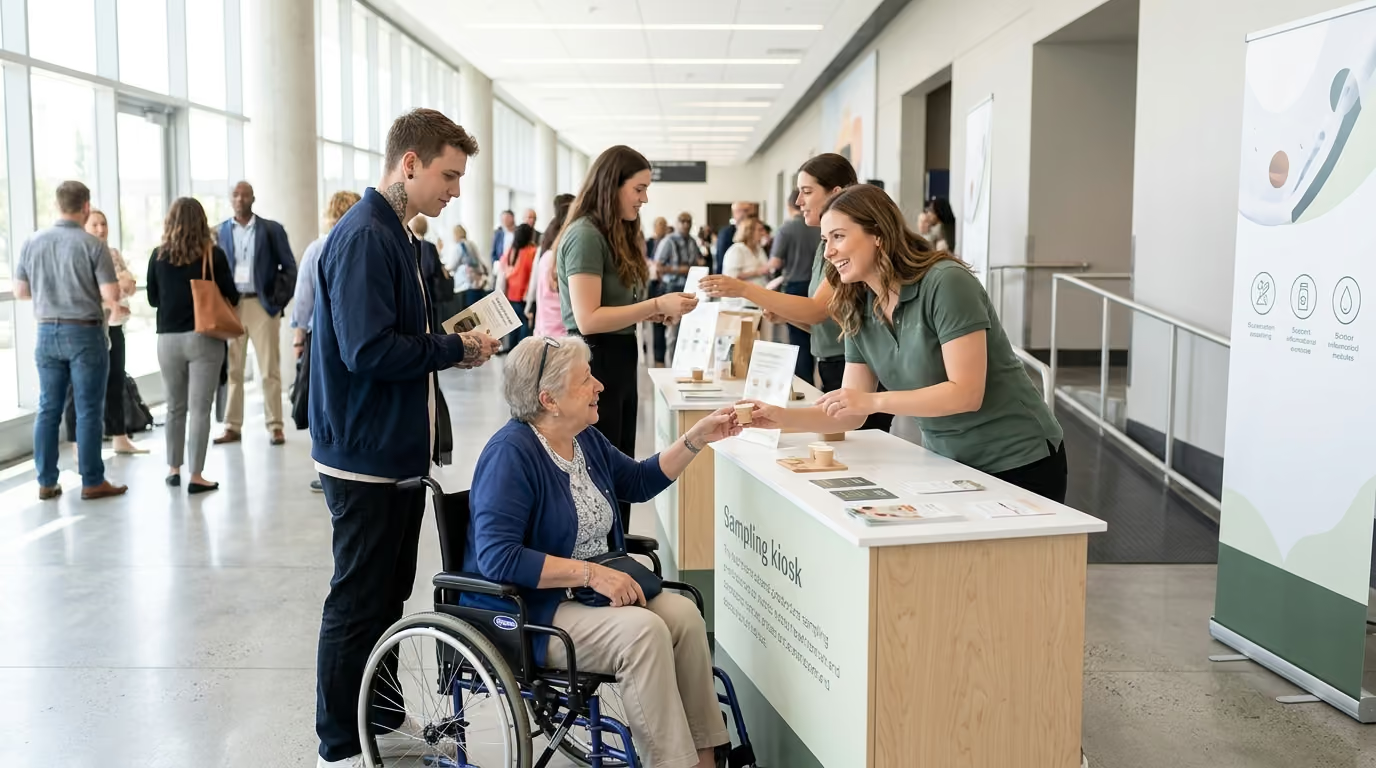
Treating accessibility as an afterthought creates legal exposure and damages brand reputation. The U.S. Access Board enforces clear guidelines for temporary exhibits, stages, and public event structures. Service counters must include accessible lower sections, cable ramps must feature beveled edges for wheelchair access, and queue layouts must accommodate individuals with mobility devices.
Modern mobile activations often utilize digital tools, geofencing, and mobile registration mechanics. Operating teams must handle consumer location data with strict regulatory discipline.
The Federal Trade Commission has taken decisive enforcement actions against companies for collecting, aggregating, and sharing precise consumer geolocation data without obtaining affirmative, informed consent. Brand teams must ensure that all digital registration flows, QR code landing pages, and sweepstakes forms include transparent privacy notices and clear consent checkboxes. Never track precise mobile location data without verifiable consumer authorization.
A location contract that grants access from nine in the morning until five in the evening does not allow for an eight-hour activation. A vehicle footprint requires anywhere from forty-five minutes to two hours for electrical setup, health code sanitization, refrigeration cooling, and structural deployment. Build operational buffers into site booking agreements to avoid cutting live engagement hours short.
To build an accountable, repeatable field marketing program, brand leaders must measure location performance through standardized quantitative metrics. Tracking performance requires monitoring both leading operational indicators and lagging commercial outcomes.
To compare venues with vastly different foot traffic volumes, calculate the Effective Conversion Yield for each site.
Effective Conversion Yield equals Relevant Audience multiplied by Availability Factor multiplied by Stop Rate multiplied by Completion Rate multiplied by Redemption Rate.
This equation prevents high-volume, low-quality commuter sites from looking superior to smaller, high-converting community retail placements.
Location quality directly impacts how effectively brand ambassadors work. If a location is poorly configured, staff spend their time managing line bottlenecks or running for ice rather than engaging consumers. Maintaining high productivity requires professional talent management, as outlined in our guide to staffing mobile sampling teams.
Evaluate venue efficiency by measuring Qualified Engagements Per Staff Hour: total qualified brand interactions completed divided by total labor hours worked on site. When this metric drops, review the footprint layout and intercept position to eliminate operational drag.
A functional beverage brand launched a thirty-day field tour across Southern California to support its expansion into two hundred regional supermarket accounts. The marketing objective was clear: generate trial among active, health-conscious adults and drive immediate, measurable retail checkout velocity.
The marketing team tested two contrasting location archetypes across twelve operating markets:
The brand deployed its mobile van footprint near high-traffic urban commuter rail stations during the morning rush hour. The sites offered massive gross foot traffic, averaging over four thousand pedestrians per hour.
The results revealed severe operational friction. The Stop Rate was only 2.1 percent because commuters were rushing to trains. Handout speed was high, but interaction time averaged under eight seconds. Digital coupon redemption reached only 1.4 percent because consumers boarded transit and forgot the offer. The fully loaded Cost Per Qualified Interaction stood at $8.45.
The team shifted the footprint to the parking plazas of partner supermarket accounts carrying the product line. Gross foot traffic was significantly lower, averaging four hundred fifty pedestrians per hour.
The results demonstrated high commercial efficiency. Audience fit was 88 percent qualified shoppers. The Stop Rate jumped to 18.5 percent as relaxed consumers approached the vehicle. Interaction time averaged forty-five seconds, allowing brand ambassadors to explain product benefits and hand out cold samples alongside an instant $1.50 off store coupon. Digital and physical coupon redemption reached 34.2 percent inside the adjacent store. Store-level retail sales surged 142 percent over pre-activation baseline levels during the tour period. The fully loaded Cost Per Qualified Interaction dropped to $2.15.
By shifting tour routing entirely to Strategy B venues for the remaining three weeks of the tour, the brand maximized its retail sell-through and established verified velocity across all partner accounts.
Review this location selection framework whenever your brand encounters any of the following operational milestones:
Selecting the right physical environment transforms mobile marketing from an unpredictable expense into a reliable, scalable driver of business growth.

30 Years Experiential & Retail Activation Partner for CPG & Beverage Brands | Multi-Market Demos, Roadshows & Costco/Club Programs That Actually Sell