"Retail activation compliance tracking failures." Brand leaders frequently search this exact phrase after discovering that thousands of budgeted retail hours produced inconsistent store presence and unverifiable field recaps. This comprehensive guide establishes an operational quality control system that eliminates guesswork through structured verification, clear denominators, photographic standards, and meticulous inventory reconciliation.
The Store Floor Reality
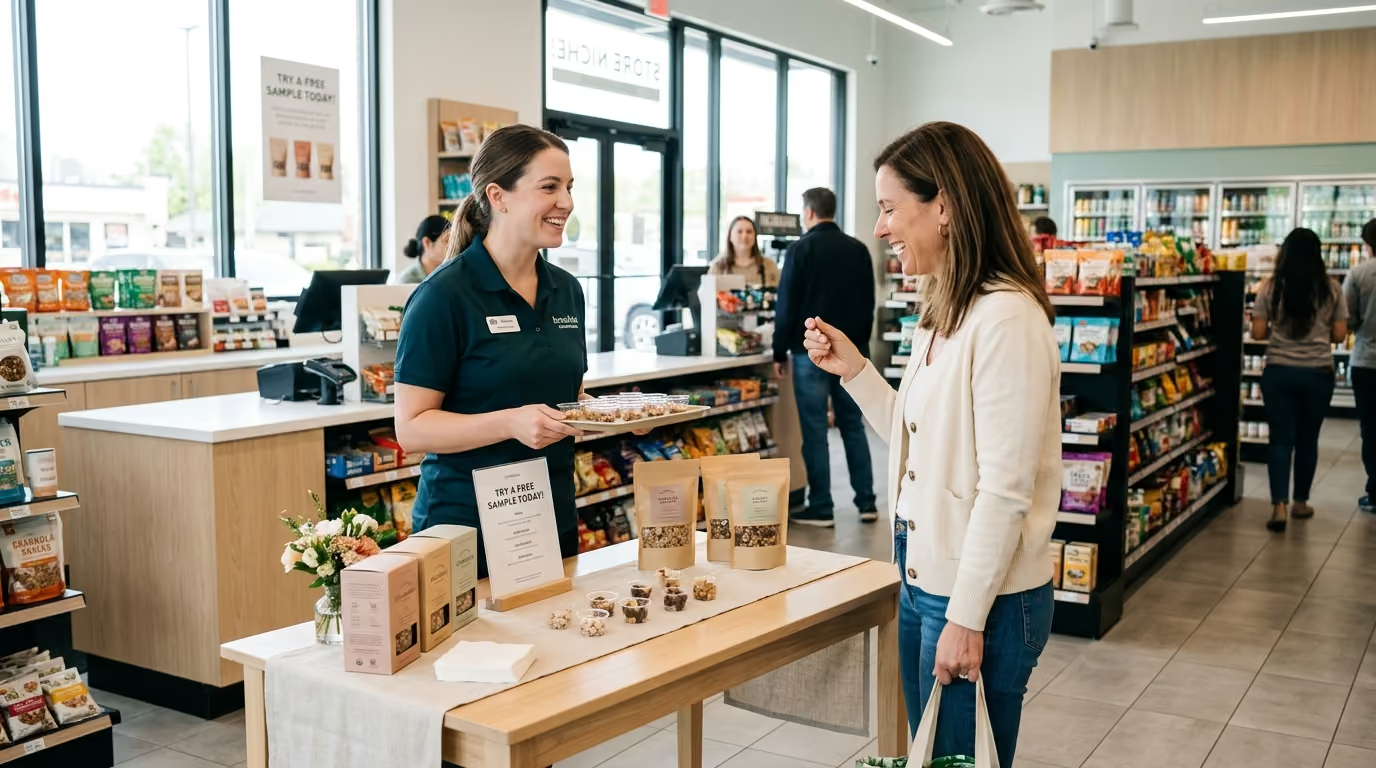
Walk into a major grocery location on a Saturday afternoon during a scheduled product activation. Brand directors at headquarters envision a clean demonstration station, cold inventory, and trained ambassadors engaging shoppers at the primary endcap.
The physical reality on the floor tells a completely different story. The store manager claims no knowledge of the scheduled activation date. The promotional pallet sits untouched in the rear receiving bay behind stacked produce crates. The field specialist arrived twenty minutes late without sanitary gloves or the mandated branded table cover. Two hours of peak weekend foot traffic vanish before the first sample reaches a consumer.
Forty-eight hours later, the brand team receives an automated recap report. The document shows a generic five-star rating and an unchecked box claiming full operational compliance. There are no timestamps, no verifiable store photos, and no inventory counts. The brand paid full price for a ghost execution, leaving leadership with zero defensible data to prove retail performance.
Structural Pillars of Retail Activation Audits
Establishing verifiable operational control requires moving past basic yes-or-no checklists. A binary presence check fails to capture whether an activation was late, incomplete, poorly located, or missing inventory. According to the 2024 Compliance and Sustainability Report published by POPAI UK and Ireland, retail compliance consists of multiple distinct operational dimensions rather than a simple confirmation of presence.
Primary Audit Dimensions
An operator-grade quality audit documents specific execution conditions across every single store visit:
- Store and Visit Identity: Official retailer store number, physical street address, scheduled date, auditor or lead ambassador name, and unique activation tracking identification.
- Timing Verification: Exact gate arrival timestamp, setup completion timestamp, first consumer engagement timestamp, and scheduled teardown completion timestamp.
- Precise Store Placement: Assigned department, specific aisle number, bay identifier, endcap orientation, entrance placement, or designated perimeter demo zone.
- Physical Display Condition: Structural assembly status, missing hardware components, transit damage, unit stability, surface cleanliness, and sanitation compliance.
- Brand and Pricing Accuracy: Authorized marketing artwork, correct promotional pricing signage, current packaging variants, and approved regulatory claim callouts.
- Inventory Accounting: Beginning stock on shelf, backroom reserve inventory, transferred demo stock, damaged units, distributed samples, and final shelf count.
- Functional Components: Operating status of electrical hookups, digital screens, refrigeration units, mechanical dispensers, and lighting fixtures.
- Activation Duration: Documented confirmation that the footprint remained active and operational for the entire contracted time window.
- Exception Tracking: Standardized numerical failure codes for missed visits, manager refusals, out-of-stock conditions, or mechanical breakdowns.
- Visual Evidence: Wide-angle contextual photographs, close-up asset images, and verified metadata capturing physical store surroundings.
Separating these elements prevents field teams from masking structural failures behind general completion scores. Our team has been connecting brands with people through live experiences, retail programs, and national activations since 1995. Over three decades in the field, we have learned that precision in audit collection protects marketing budgets from operational drift. You can learn more about structuring standard operating procedures in our guide to retail activation compliance standards.
Measurement Reliability and the Denominator Problem
Retail compliance data across the consumer goods industry is frequently fragmented and inconsistent. The 2024 POPAI research revealed that only three surveyed companies tracked four or more standard compliance requirements. The study also revealed that only three-quarters of brands knew how much temporary display material was actually placed inside retail stores.
The perception of execution success often diverges sharply from verified floor reality. In the POPAI study, 38 percent of participating brands and retailers estimated their temporary display compliance fell between 80 percent and 99 percent. Meanwhile, 46 percent of respondents believed their compliance landed between 60 percent and 79 percent. Some individual respondents reported ranges swinging from 30 percent to 90 percent depending on the specific retailer or display format.
A major driver of inflated reporting is the denominator problem. When agencies calculate compliance using only completed store visits, they artificially hide operational failures. A campaign that scheduled 1,000 stores but only visited 700 cannot claim a 95 percent compliance rate based on the 665 successful visits. The real compliance rate across the contracted investment is 66.5 percent.
The Standardized Denominator Hierarchy
To establish absolute measurement integrity, brand operators must categorize every store across an unambiguous audit funnel:
- Stores Scheduled: The total universe of contracted retail locations funded in the scope of work.
- Stores Attempted: Locations where field staff physically arrived at the store address and attempted to check in.
- Stores Reached: Locations where staff gained access to the retail floor and established contact with department managers.
- Stores Successfully Activated: Locations where the complete footprint was constructed and consumer engagement occurred.
- Stores Passing Individual Criteria: Locations meeting specific standalone standards for timing, placement, inventory, and branding.
- Stores Fully Compliant: Locations satisfying 100 percent of audit criteria without a single variance or exception.
- Stores Requiring Remediation: Locations where operational failures were corrected on-site during the scheduled window.
- Stores with Unknown Status: Locations with missing, corrupted, or unverified field reports.
Research published in the Journal of the Royal Statistical Society by authors analyzing store auditing models demonstrated that statistical sampling methods can accurately capture store conditions across large retail networks. Tracking the complete denominator structure prevents unvisited stores from disappearing from performance reports. Establishing rigorous field marketing measurement plans guarantees that executive reporting reflects genuine field execution.
Historical Display Placement Benchmarks
Historical data compiled by POPAI shows that physical asset formats encounter different operational failure rates. In 2005 research tracking placement across retail formats, overall point-of-purchase placement stood at 65.1 percent.
Specific display categories demonstrated wide variances in execution:
- Hanging signs achieved a 74.5 percent placement rate.
- Shelf-edge point-of-purchase materials reached a 73.0 percent placement rate.
- Prepacked shippers recorded a 70.6 percent placement rate.
- Shelf trays achieved a 67.8 percent placement rate.
- Header boards reached a 67.5 percent placement rate.
- Permanent branded units achieved a 61.4 percent placement rate.
- Flat-packed temporary displays recorded a 40.7 percent placement rate.
These structural differences explain why flat-packed displays and complex demo kits require higher audit frequency. When field staff must assemble intricate physical footprints under tight store deadlines, execution failure rates increase significantly.
Photographic and Timestamp Verification Standards
Photographs serve as primary evidence of physical compliance, but loose photo collection creates administrative chaos. A generic photo of a branded table against a blank wall provides zero proof of store identity or floor placement. The POPAI research notes that large retail networks frequently rely on visit snapshots because auditing every square foot of an estate remains challenging.
The Photographic Capture Protocol
Field personnel must capture a standardized four-photo sequence for every single activation shift:
- Contextual Wide Angle: A wide view showing the activation footprint in relation to surrounding aisles, departmental signage, and ceiling fixtures.
- Point-of-Sale Close-Up: A direct shot of the demo station or display highlighting promotional pricing, product packaging, and sanitary preparation.
- Inventory Shelf Staging: A clear photograph of the primary home-shelf location showing product stock depth and adjacent competitive facings.
- Store Sign-In Document: A clear image of the official store manager log sheet featuring the retail manager signature and store timestamp.
Every submitted photograph must retain raw Exchangeable Image File format metadata. This metadata records exact latitude, longitude, altitude, capture date, and precise local time. Modern field audit software must cross-reference image coordinates against the retailer geofence. If an image is captured outside the store perimeter, the system must reject the submission immediately.
Photographs provide critical evidence for visual condition, assembly accuracy, and visible inventory levels. They do not, however, measure shopper dwell time, total category foot traffic, or continuous compliance throughout a six-hour shift. Photographic records must function as one layer within a multi-tiered verification framework.
Inventory Reconciliation and Activity Tracking
Inventory management during live sampling events requires strict mathematical controls. In our experience managing retail sampling and demonstration programs, unaccounted inventory leakage degrades overall program profitability. Field staff must document product flow from backroom storage to consumer hands.
Sampling Volume Benchmarks
Understanding field activity benchmarks helps brand managers evaluate staff productivity and verify recap credibility. Published industry research from PortMA analyzed field reports covering 8,456 activation days and 42,669 consumer exit interviews across retail venues. Their historical dataset documented 333,252 non-alcoholic wet and dry product samples distributed during intercepted shopper engagements.
This dataset demonstrates the importance of separating distinct physical actions in field reporting:
- Samples Distributed: The exact physical count of edible portions or single-use sample packets handed directly to consumers.
- Consumer Exit Interviews: Structured qualitative and quantitative survey interactions conducted immediately following a product engagement.
- Product Demonstrations: Complete instructional walkthroughs or taste tests delivered to an individual shopper or family group.
- Commercial Units Sold: Verified retail register purchases of the featured product during the active demonstration window.
A common reporting mistake involves blending sample distributions and survey responses into a single vague reach metric. Handing out a sample requires five seconds, while conducting a structured exit interview requires several minutes. High-performing brand teams require staff to log both metrics independently to evaluate conversion efficiency.
The Mathematical Inventory Reconciliation Model
Field personnel must complete a standardized balance sheet for every product stock keeping unit before leaving the retail facility:
- Opening Backroom Inventory: Unopened cases located in the store warehouse prior to activation.
- Opening Shelf Inventory: Saleable units sitting on the retail shelf fixture prior to activation.
- Transferred Demo Stock: Product units pulled from inventory specifically for sampling preparation.
- Mid-Shift Restock: Additional inventory pulled from backroom storage to replenish retail shelves.
- Distributed Sample Units: Finished consumer portions created from pulled demo inventory.
- Spoiled or Damaged Stock: Product lost due to packaging failure, drop damage, or temperature deviation.
- Closing Shelf Inventory: Saleable units remaining on the active store shelf at shift conclusion.
- Closing Backroom Inventory: Full cases remaining in the store warehouse at shift conclusion.
The mathematical balance must resolve cleanly: opening stock plus restock minus demo pulls and register sales must equal closing stock. When field teams reconcile inventory against register scan data, brands uncover the true relationship between sampling volume and direct retail velocity. When managing running product sampling campaigns, this level of accounting uncovers inventory shrink and optimizes case ordering schedules.
Step-by-Step Field Execution Playbook
Executing an audit protocol requires clear operational workflows for field specialists and regional supervisors. This structured sequence guides staff from initial store arrival through final digital submission.
Phase 1: Pre-Arrival Verification
- Step 1: Review the digital run-of-show document 24 hours prior to the shift to verify store address, contact names, and asset requirements.
- Step 2: Confirm digital audit software is updated, battery reserves are fully charged, and local store geofences are downloaded for offline tracking.
- Step 3: Inspect demonstration kit hardware, food-grade sanitation supplies, table covers, and regulatory certification cards before traveling to the venue.
Phase 2: In-Store Arrival and Check-In
- Step 4: Arrive on location exactly 45 minutes prior to the scheduled consumer engagement window.
- Step 5: Locate the store manager on duty, present official credentials, and obtain a signature on the store arrival log sheet.
- Step 6: Trigger the mobile audit application check-in button to capture GPS coordinates and local timestamp metadata.
- Step 7: Inspect the designated activation space to identify electrical outlets, floor hazards, customer traffic corridors, and line-of-sight visibility.
Phase 3: Setup and Baseline Audit
- Step 8: Locate allocated promotional inventory in the backroom or overhead racking and record initial case counts.
- Step 9: Count active shelf units at the primary retail home location and log opening stock numbers into the mobile form.
- Step 10: Assemble the branded demonstration station according to official planogram schematics and safety guidelines.
- Step 11: Capture the baseline wide-angle and close-up photographs showing the fully prepared station and pricing signage.
- Step 12: Verify functionality of all cold storage, hot plates, digital tablets, and lighting elements prior to opening the sample station.
Phase 4: Live Activation and Tracking
- Step 13: Initiate consumer sampling precisely at the scheduled start time and begin tallying shopper interactions using physical hand counters.
- Step 14: Log sample distributions, consumer taste reactions, and product objections at 30-minute intervals to track hourly velocity.
- Step 15: Monitor primary retail shelf inventory every hour and replenish stock from backroom reserves when shelf depth drops below three units.
- Step 16: Document any store disruptions, retail management requests, or equipment failures using standardized operational exception codes.
Phase 5: Teardown and Final Reconciliation
- Step 17: Conclude active consumer sampling precisely at the scheduled end time and secure remaining product inventory.
- Step 18: Sanitize all preparation equipment, break down display tables, and return the retail floor area to pristine condition.
- Step 19: Conduct the final physical count of backroom cases and retail shelf units to complete the inventory reconciliation ledger.
- Step 20: Obtain the final checkout signature from the store manager on duty and record the official departure timestamp.
- Step 21: Capture the final teardown area photograph showing a clean, debris-free retail aisle.
- Step 22: Submit all completed audit fields, high-resolution photographs, and qualitative consumer field notes through the mobile application before departing the property.
Following this execution structure prevents data gaps and provides regional supervisors with immediate visibility into store performance. When coordinating high-volume store demonstrations, standardized workflows keep large distributed teams aligned.
Quality Control Metrics and Lead-Lag Variance Reporting
To prove marketing Return on Investment (ROI), brand leaders must separate leading operational indicators from lagging financial results. Tracking leading indicators allows program managers to correct execution flaws mid-campaign before they compromise final sales performance.
Leading Execution Metrics
Leading metrics reflect real-time operational discipline during the active campaign:
- On-Time Arrival Rate: The percentage of scheduled shifts where field staff completed store check-in at least 30 minutes prior to live engagement.
- Complete Data Submission Rate: The percentage of shift recaps submitted with all mandatory audit fields, timestamps, and metadata attached.
- Photo Compliance Score: The proportion of uploaded images that satisfy composition, lighting, angle, and geofence standards.
- Shelf Replenishment Frequency: The average number of restock actions completed during an activation shift to prevent out-of-stock conditions.
- Protocol Adherence Rate: The percentage of locations meeting strict sanitation, uniform, and messaging guidelines during unannounced supervisor field audits.
Lagging Performance Metrics
Lagging metrics evaluate commercial impact and financial return after shift completion:
- Total Net Conversion Rate: The percentage of consumers accepting a sample who subsequently placed a product unit into their shopping cart.
- Cost Per Verified Interaction: Total activation expenditures divided by the verified count of completed one-on-one consumer demonstrations.
- Same-Day Baseline Sales Lift: Percentage increase in register scan units during the activation window compared to identical pre-activation historical time blocks.
- Post-Activation Halo Lift: Sustained percentage sales volume increases measured across four to eight weeks following the activation date.
- Inventory Variance Percentage: Total numerical difference between calculated product depletion and actual register scan volumes.
Operational Exception Codes
When field teams encounter store resistance, logging clear exception codes isolates external retail friction from staff performance issues:
- Code 101 - Access Refused: Store manager denied entry due to uncommunicated scheduling or corporate policy disputes.
- Code 102 - Footprint Space Unavailable: Floor space occupied by competing promotional shippers or seasonal merchandise displays.
- Code 103 - Zero Product Inventory: Scheduled product inventory was out of stock or never arrived from the distribution center.
- Code 104 - Pricing Discrepancy: Retail shelf tag displayed an incorrect price or failed to reflect active promotional discounts.
- Code 105 - Hardware Failure: Critical equipment such as display lighting, power access, or refrigeration units failed to operate.
- Code 106 - Early Termination: Shift ended early due to extreme weather, safety concerns, or direct store management instruction.
Standardizing exception tracking enables trade marketing teams to hold retail partners accountable during joint business planning reviews.
High-Volume Consumer Goods Demonstration Protocols
Managing quality control across hundreds of retail locations requires strict alignment between field specialists, regional field managers, and retail grocery partners. Consider an illustrative example, not a client result. A natural beverage brand faces severe compliance challenges across several hundred grocery supermarket locations.
The brand marketing team suspected significant execution drift. Previous field agencies submitted inconsistent PDF recaps showing basic completion tallies. Store managers frequently complained about delayed setups, missing promotional signage, and cluttered staging areas. More critically, regional sales managers reported that retail endcaps sat empty while product cases languished in backroom warehouses.
The Turnaround Strategy
To resolve these operational breakdowns, the brand instituted a comprehensive quality control framework centered on verified field evidence:
- Geofenced Check-Ins: Brand ambassadors checked into an audit application that validated store presence against GPS parameters before unlocking the shift workflow.
- Standardized Visual Verification: Staff captured mandatory four-point photo sequences showing backroom stock, assembled tables, home-shelf inventory, and signed manager logs.
- Active Inventory Balancing: Specialists counted shelf stock upon arrival and restocked shelves every 45 minutes, recording case pulls directly in the mobile log.
- Mid-Shift Quality Audits: Regional supervisors conducted unannounced spot checks across 15 percent of active locations, scoring stations on cleanliness, messaging, and uniform standards.
- Real-Time Exception Routing: When ambassadors encountered zero-stock conditions, the system routed an automated alert to the regional trade broker within fifteen minutes to initiate inventory replenishment.
Concrete Business Outcomes
Establishing strict quality control transformed the brand field execution across all 450 retail locations:
- Audited Shift Compliance: The verified completion rate across all scheduled stores rose from an unverified 72 percent estimate to an audited 96.4 percent execution rate.
- Out-of-Stock Reduction: Active shelf restock protocols reduced mid-shift out-of-stock incidents from 28 percent of stores down to 4.2 percent.
- Sample Velocity Gains: Standardized station layouts and active staff coaching increased average sample distributions from 38 units per hour to 61 units per hour.
- Retail Sales Uplift: Stores adhering to 100 percent of audit criteria generated an average 184 percent sales lift over baseline during demo hours, compared to 62 percent in non-compliant stores.
By treating quality control as a systematic discipline, the beverage brand proved that rigorous field data collection protects retail trade investments and builds lasting retailer trust.
Next Steps for Program Implementation
Transforming your field operations begins with auditing your current quality control processes. Use this operational checklist to upgrade your verification standards this week.
Immediate Action Checklist
- [ ] Define your campaign denominator hierarchy to track scheduled, attempted, reached, and compliant stores separately.
- [ ] Update mobile audit forms to capture mandatory four-photo sequences including wide-angle context, close-ups, shelf staging, and signed manager logs.
- [ ] Implement mandatory Exchangeable Image File metadata validation to confirm capture timestamps and GPS coordinates against store geofences.
- [ ] Establish a standardized inventory balance ledger tracking backroom stock, shelf inventory, transferred demo units, and register sales.
- [ ] Separate simple sample distribution tallies from structured consumer exit interviews in all field reporting templates.
- [ ] Standardize numerical exception codes for access refusals, missing inventory, space constraints, and equipment failures.
- [ ] Establish weekly variance reporting to analyze the performance gap between leading execution metrics and lagging retail sales lift.
Sources
- sciencedirect.com
- sciencedirect.com
- sciencedirect.com