Robbie Thain
Founder, CEO

Profitable regional field campaigns require multi-layered geographic routing, disciplined route economics, civic hub integration.
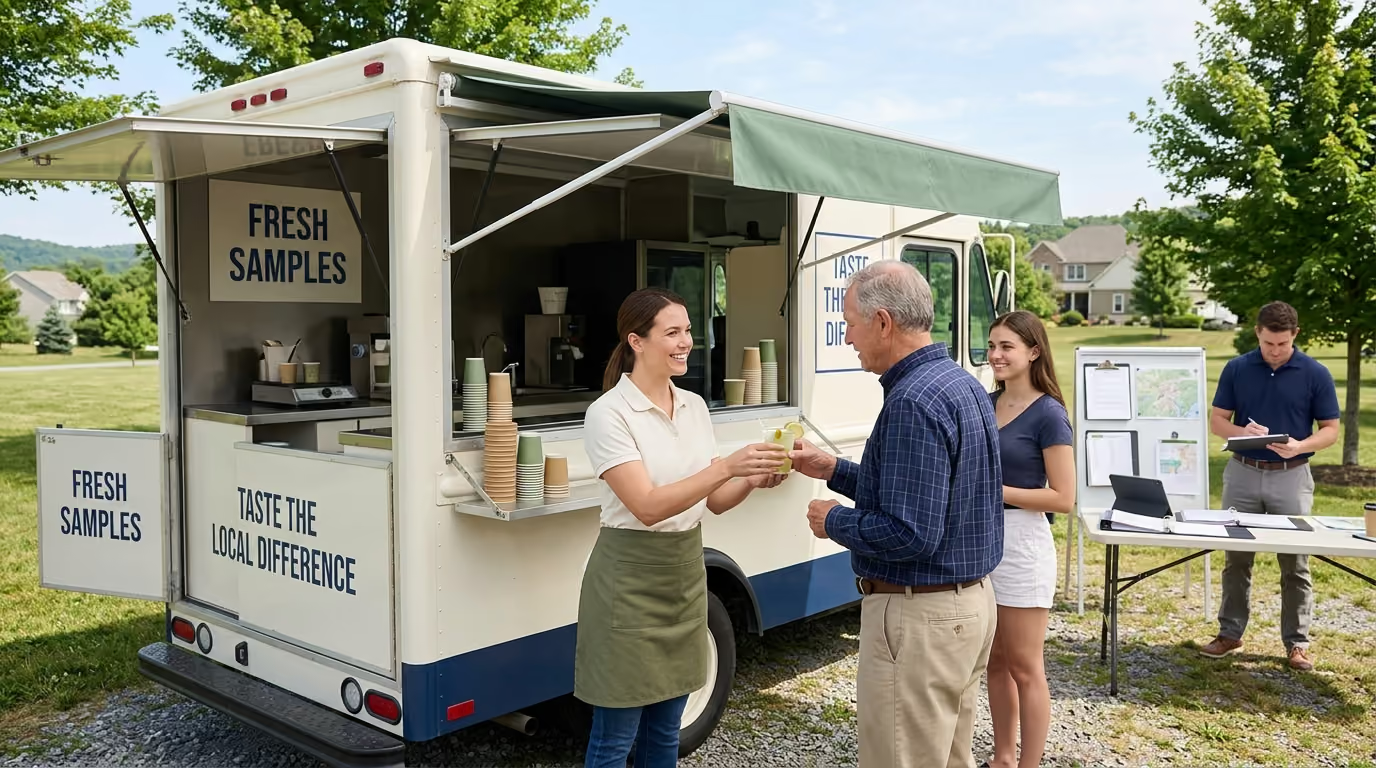
A mobile sampling tour across suburban and rural markets is a structured, vehicle-supported distribution system that brings hands-on product trials directly to geographically dispersed consumer clusters. It is not an urban street stunt, a random parking lot giveaway, or a loose collection of unconnected weekend stops. This guide outlines the operational frameworks, route economics, community integration models, and retail conversion architectures required to build high-converting field campaigns across America's heartland and suburban corridors.
Managing a mobile activation outside major metropolitan centers presents immediate logistical friction. Tour operators often find themselves navigating three-hour drives between secondary towns, only to arrive at regional shopping centers with unconfirmed site access and fluctuating cellular coverage. Meanwhile, local retail buyers expect immediate inventory movement, brand managers demand digital engagement data, and field crews face sudden shifts in local weather without covered venue fallbacks. Turning these dispersed miles into profitable retail velocity requires replacing guesswork with rigorous route modeling and disciplined field execution.
Urban sampling strategies traditionally rely on raw pedestrian density. In major downtown cores, brands can park a branded vehicle near transit hubs or central plazas to distribute thousands of units within a four-block radius. Suburban and rural markets operate on a completely different physical and psychological model. Consumers in these regions do not walk past your activation by accident during a morning subway commute. They travel by vehicle along arterial highways, schedule their routines around regional schools, and congregate around specific civic, athletic, and retail hubs.
According to the USDA Economic Research Service, the U.S. rural population reached approximately 46.2 million people in July 2024, representing 13.6 percent of the total national population. While these consumers represent massive collective purchasing power, their physical dispersion means that tour success cannot be measured simply by foot traffic volume. Federal Highway Administration data shows that rural roads accounted for roughly 1.009 trillion vehicle-miles of travel in 2023. Rural and exurban consumers are accustomed to driving significant distances for commerce, recreation, and community gatherings.
This geographic dispersion changes the fundamental nature of the consumer engagement. In dense urban centers, street sampling interactions frequently last less than thirty seconds as pedestrians grab a product and keep walking. In suburban town centers, county fairgrounds, and regional retail plazas, consumers demonstrate significantly longer dwell times. They are willing to talk with brand ambassadors, ask questions about ingredients or usage, and participate in full product demonstrations.
The primary challenge in non-urban activations is optimizing route density. When distances between stops stretch across county lines, driving hours, fuel consumption, and crew lodging quickly erode campaign margins if schedules are poorly designed. Tour planners must approach suburban and rural markets not as isolated events, but as integrated retail ecosystems. When properly orchestrated, mobile sampling tours that deliver your brand straight to your audience create lasting brand loyalty and drive measurable sell-through across regional retail accounts.
Constructing an effective mobile tour route through secondary and tertiary markets requires a multi-layered geographic mapping strategy. Relying solely on municipal population numbers leads to severe misallocations of field resources. A town of 15,000 residents that serves as a regional agricultural and commercial hub often generates three times the engagement of an inner-ring bedroom suburb with 40,000 residents.
A rigorous geographic planning model combines six distinct analytical layers to identify optimal activation zones.
Planners must evaluate census tracts and ZIP codes to pinpoint target household profiles rather than gross population counts. In suburban corridors, look for concentrations of multi-person households, active families, and specific income brackets that match your price point. In rural zones, identify regional trading centers where residents from surrounding unincorporated communities converge for weekly errands.
Sampling without immediate retail availability creates awareness without commercial conversion. Map every retail door currently stocking your promoted SKUs, including regional supermarket chains, mass merchandisers, independent grocers, convenience stores, and farm supply outlets. USDA food-access methodology identifies a rural low-access threshold as being more than 10 miles from a supermarket, compared to more than 1 mile in an urban setting. Your activation footprints should sit well within this commercial travel threshold to ensure consumers can act on their trial experience.
Evaluate state highways, interstate bypasses, commuter corridors, and primary retail strips. Identify natural choke points where rural and suburban drivers travel for daily routines. Map commercial vehicle access constraints, including low-clearance bridges, weight-restricted secondary roads, and turning radius limitations for trucks towing heavy experiential trailers.
Map community infrastructure that serves as social anchors across non-urban regions. This includes county fairgrounds, regional sports complexes, high school athletic stadiums, farmers markets, public libraries, recreation centers, and community colleges. These locations provide pre-established foot traffic and built-in community trust.
Identify regional competitor activations, established seasonal festivals, county fairs, and local sports tournaments. Evaluating these elements prevents scheduling conflicts and highlights opportunities where your brand can stand out without competing against entrenched local category sponsors.
Dispersed routing requires dedicated support nodes to keep mobile assets functioning smoothly. Map commercial cold-storage facilities, regional warehousing partners, commercial vehicle repair shops, overnight secure parking lots, and reliable water hookups. Document mobile connectivity dead zones across rural counties. USDA reports indicate that 22.3 percent of Americans in rural areas lack coverage from fixed terrestrial broadband at benchmark speeds, compared to 1.5 percent in urban areas. This makes offline-capable field technology an absolute operational necessity.
The financial viability of a rural or suburban mobile sampling tour depends on balancing fixed tour overhead against variable mileage and site activation expenses. In dense cities, a single parking permit can yield eight continuous hours of high-volume consumer engagement. In dispersed markets, long travel times between secondary towns can easily consume valuable operating hours if routes are planned inefficiently.
To protect campaign margins, tour strategists must break down costs into three distinct categories:
Fixed costs remain constant regardless of the mileage traveled each week. These include:
Variable costs increase directly with route distance and transit duration. These include:
Site costs occur specifically at the point of consumer engagement. These include:
Field marketing directors should evaluate potential stops using precise operational metrics rather than subjective enthusiasm.
First, calculate the Productive-Hour Ratio to assess schedule efficiency:
Productive-Hour Ratio = Consumer-Facing Activation Hours / Total Paid Operating Hours
In dispersed markets, driving and setup logistics can quickly suppress this ratio. A well-optimized suburban route maintains a ratio above 0.60, ensuring that the majority of paid field labor is spent engaging consumers.
Second, determine the Cost per Productive Hour:
Cost per Productive Hour = Total Market Operating Cost / Consumer-Facing Activation Hours
This calculation reveals the true expense of remote activations. A rural festival with low site fees may seem cost-effective on paper, but an eight-hour round-trip drive requiring two nights of hotel accommodations can dramatically elevate the cost per productive hour.
Third, establish the Stop-Value Threshold before booking remote locations:
Required Stop Value = Incremental Travel Cost + Incremental Labor Cost + Incremental Lodging + Incremental Inventory Risk + Target Margin Contribution
If a remote community event cannot deliver enough verified consumer interactions or drive sufficient local retail volume to clear this financial threshold, the stop should be removed from the tour schedule. For deeper planning on cost containment, review our guide to operational efficiency for mobile sampling tours.
A common failure in experiential marketing is creating memorable brand interactions that fail to generate measurable retail velocity. In rural and suburban territories, where retail footprints are spread across wide trade areas, sampling activations must be directly linked to the physical point of purchase.
In our experience, consumer product sampling achieves its highest Return on Investment when the trial experience is tightly synchronized with nearby retail inventory. We specialize in creating retail demos, product sampling programs, and roadshows that bring brands face to face with their audiences. Each program is designed to drive trial, build consumer relationships, and accelerate retail velocity across multiple locations.
To bridge the gap between initial trial and shelf pull, brands should utilize three proven retail conversion models:
Executing directly on the perimeter or parking lot of a retail partner creates an immediate path to purchase. Consumers sample a cold beverage or snack product, receive a tangible discount coupon, and walk straight into the store to purchase a full package.
To execute this format successfully:
When activating at county fairs, high school football games, or community festivals, the nearest retail store may be several miles away. The activation must provide a frictionless mechanism to guide consumers to authorized local retailers following the event.
Key operational tactics include:
A corridor sweep involves deploying a mobile sampling unit across a concentrated cluster of four to six retail doors along a single commercial highway over a two-day period.
This model offers significant operational advantages:
When planning these retail integrations, review how mobile pop-up tours support retail expansion to align your field schedule with regional distributor deliveries.
Suburban and rural communities possess distinct civic ecosystems. Entering these markets with an overly slick, detached corporate posture often creates consumer skepticism. Successful field teams integrate themselves directly into local traditions, leveraging established community partners to secure prime event real estate and authentic consumer trust.
Before committing a mobile sampling footprint to a community calendar, evaluate the opportunity across key operational criteria:
Certain event categories consistently deliver superior engagement quality in suburban and rural territories:
To build authentic long-term equity within non-urban markets, field teams should avoid extractive marketing tactics. Always hire qualified local brand ambassadors to supplement your traveling tour managers, providing valuable regional knowledge and familiar accents. Source vehicle fuel, ice, and daily activation supplies from independent local merchants whenever possible. Finally, coordinate with local food banks or community shelters to donate surplus sampling inventory at the conclusion of each market stop, demonstrating tangible goodwill to the host community.
Selecting the correct mobile vehicle configuration is one of the most critical decisions in tour planning. A vehicle setup that thrives on wide suburban boulevards may fail completely on narrow rural roads or soft fairground turf.
Each vehicle classification presents distinct operational advantages and trade-offs:
These compact platforms represent the most agile option for mobile sampling tours.
Dedicated box trucks strike an effective balance between storage volume and operational flexibility.
Towed trailers allow for expansive, immersive brand environments that can be detached on site.
A hybrid approach utilizing a branded transport van combined with commercial-grade pop-up tents and modular sampling counters.
Suburban and rural field environments routinely challenge equipment reliability. Tour vehicles must be engineered with robust operational redundancies to prevent costly downtime.
Every long-distance mobile asset should incorporate:
For detailed guidelines on permitting and route design, consult our resource on mobile sampling tour route planning and logistics.
Managing a high-velocity tour across non-urban territories requires organizing individual stops into coherent operational units termed market pods. A market pod consists of a central base town and its surrounding suburban communities, secondary towns, and retail corridors, all reachable within a ninety-minute driving radius.
Executing within market pods prevents crew burnout, minimizes non-productive transit hours, and maximizes localized promotional impact.
The step-by-step execution playbook below details how field operators should plan, deploy, and manage a multi-market pod campaign.
Proving the business impact of a mobile sampling tour across suburban and rural markets requires tracking both immediate operational outputs and downstream commercial outcomes. Relying strictly on total sample counts produces an incomplete picture of campaign efficacy. Distributing 5,000 samples to an unfocused crowd without driving retail sales generates little true brand value.
A mature measurement framework incorporates both leading indicators of engagement quality and lagging indicators of financial performance.
Leading metrics measure real-time operational efficiency and the depth of consumer engagement during live tour stops:
According to Event Marketer's EventTrack research, live product sampling and product trials consistently rank among the most effective drivers of consumer purchase consideration at live events. Tracking the depth of these trial experiences ensures that field teams prioritize interaction quality over reckless volume.
Lagging metrics demonstrate the commercial return generated by the mobile tour across regional retail networks:
To provide undeniable proof of sales attribution to retail buyers and executive leadership, apply a matched-market control methodology:
Incremental Lift = (Post-Tour Activated Store Sales - Pre-Tour Activated Store Sales) - (Post-Tour Control Store Sales - Pre-Tour Control Store Sales)
By comparing sales trajectories between activated stores and non-activated control stores with identical baseline sales and demographic profiles, marketing directors can confidently report true incremental revenue. For a deeper breakdown of attribution modeling, explore how to plan and execute a successful mobile sampling tour.
Examining structured execution models across distinct consumer product categories illustrates how route design, community integration, and retail coordination function in live environments.
An emerging clean-ingredient functional beverage brand needed to establish retail velocity across seventy suburban supermarket locations across the upper Midwest. Rather than activating in downtown metropolitan plazas where retail availability was fragmented, the brand deployed a customized high-roof Sprinter van across four suburban market pods.
The field team established a recurring four-day operating schedule within each suburban pod. Morning activations focused on commuter park-and-ride lots and high-traffic suburban recreation centers between 06:30 and 09:30. Midday hours were spent executing approved parking lot sampling at target supermarket doors, handing consumers ice-cold product samples paired with high-value instant-redeemable coupons. Evening hours were dedicated to youth athletic complexes and suburban community summer concerts.
The campaign achieved a 42 percent coupon redemption rate at targeted grocery doors within forty-eight hours of sample distribution. Stores within a five-mile radius of the mobile stops experienced a 28 percent sustained lift in weekly unit movement compared to non-activated control stores in adjacent suburban corridors. The brand leveraged this verified sell-through data to secure expanded secondary display placement with the regional grocery chain.
A packaged food manufacturer sought to introduce a new plant-based protein line to traditional household shoppers across rural and secondary agricultural markets in the South.
The tour utilized a 20-foot medium-duty box truck equipped with an integrated commercial demonstration kitchen. The vehicle was routed across eight county fairs and major agricultural expositions over a six-week late-summer window. The brand partnered with regional county fair boards, securing prime footprint locations adjacent to main livestock exhibition halls. Rather than distributing raw packaged samples, trained brand ambassadors prepared hot, chef-crafted recipe samples, demonstrating the product's taste and cooking versatility directly to consumers.
The interactive cooking demonstrations generated an average consumer dwell time of six and a half minutes per interaction. Every sampler received a branded recipe booklet featuring localized store locator information and unique QR codes tied to regional mass merchandisers. Regional distribution centers reported a 35 percent increase in retailer reorders across the six-week activation window, proving that traditional rural consumers readily adopt plant-based products when introduced through high-touch experiential trial.
Municipal permits, private property licensing, and local county health department food service approvals should be submitted forty-five to sixty days prior to your planned activation date. Secondary towns and rural county offices often operate with part-time administrative staff or monthly council review calendars. Initiating the permitting process early avoids costly last-minute route adjustments.
Mobile sampling footprints must be completely self-contained. Field vehicles should carry dedicated commercial trash receptacles, heavy-duty replacement liners, and localized recycling bins. Tour crews must execute continuous perimeter trash sweeps throughout the day and pack out all accumulated waste to commercial disposal dumpsters at their nightly logistics base, leaving zero brand footprint behind.
Never direct consumers to an empty retail shelf. If a nearby retail door experiences an unexpected stockout, immediately pivot your on-site messaging. Transition brand ambassadors to distributing digital store locator cards that direct consumers to the next closest authorized retailer or highlight online purchasing options. Concurrently, notify your regional sales representative to trigger an emergency distributor replenishment order.
Deploy enterprise field management and event survey software that natively supports offline data caching. All consumer sign-ups, survey completions, and ambassador operational logs should save locally to encrypted device storage. Once the vehicle returns to hotel Wi-Fi or cellular service range at the end of the operating day, the software automatically synchronizes local data with central reporting dashboards.

30 Years Experiential & Retail Activation Partner for CPG & Beverage Brands | Multi-Market Demos, Roadshows & Costco/Club Programs That Actually Sell