Robbie Thain
Founder, CEO

Predictable event ROI and frictionless visitor engagement result from systematically testing trade show messaging, floor layouts, product demonstrations.
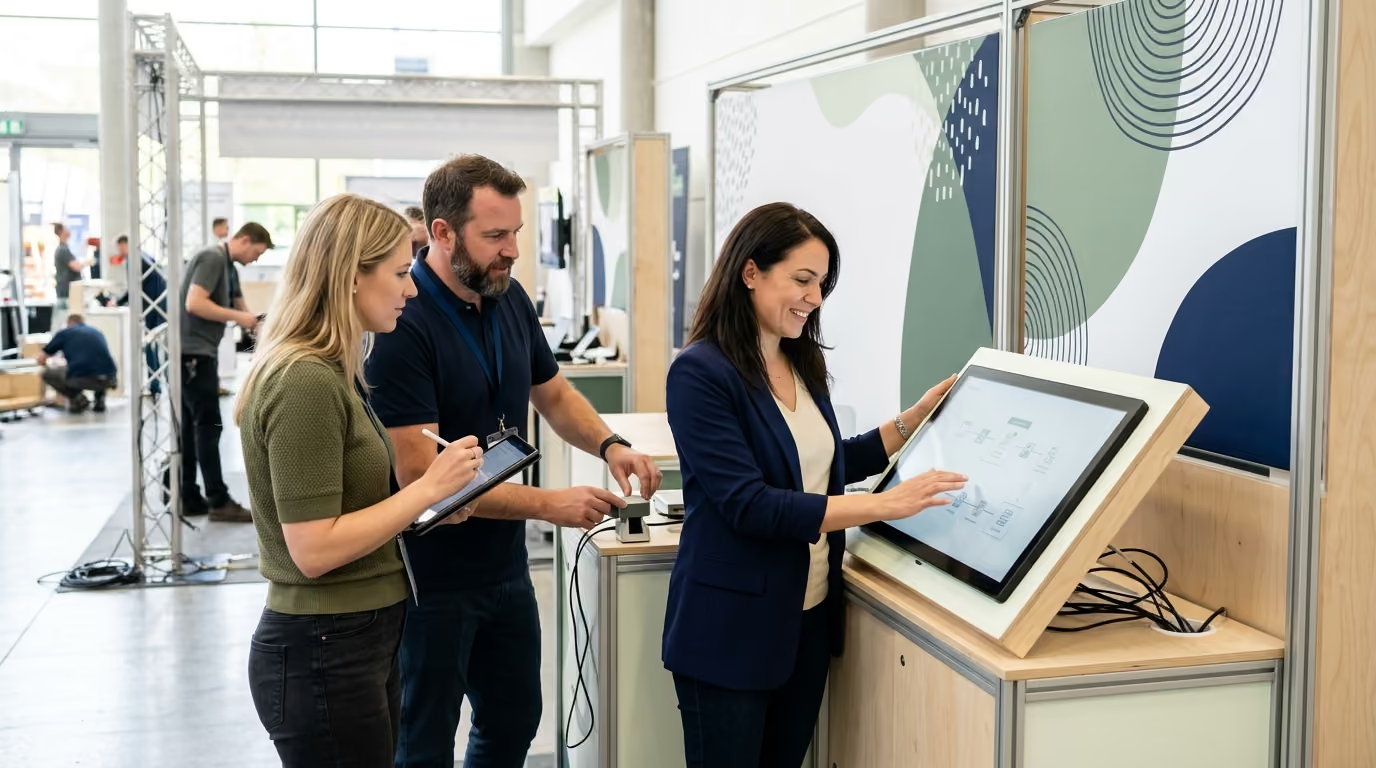
Pre-launch testing transforms trade show activations from speculative design exercises into predictable commercial engines by validating messaging, layouts, staff interactions, and data capture before the show opens. Applying an operator-grade testing protocol eliminates operational friction, protects your capital investment, and secures measurable Return on Investment (ROI) across every live interaction.
The exhibition hall opens, and within thirty minutes, the cracks in an untested activation begin to show. Visitors stop at the perimeter, squint at the overhead banner, and walk away because the core value proposition is lost in technical jargon. A crowd gathers around a flashy screen demonstration, blocking the main aisle while serious buyers cannot reach the consultation counter. Booth staff cluster together near the storage closet, nervously scanning every passing badge without asking a single qualifying question. By the final afternoon, the team celebrates capturing two thousand contacts, but sales leadership later discovers that ninety percent of those records lack purchase authority, project timelines, or verified notes.
This disconnect happens when brands treat an activation as a static visual build rather than an interconnected behavioral system. An effective activation combines physical architecture, verbal scripts, product trials, digital capture workflows, and lead routing. If you only evaluate your booth through three-dimensional digital renderings, you miss the physical bottlenecks, auditory distractions, and operational failures that happen in high-density environments. To convert real-world attention into commercial pipeline, marketing operators must test every component under realistic conditions before setting foot on the convention floor.
A trade show activation is a live sales funnel built in a physical space. Every foot of floor space represents a distinct phase of engagement, from initial awareness at the aisle boundary to qualified conversion in a meeting zone. When one component of this system fails, the entire commercial engine breaks down.
Treating an activation as an integrated system requires testing each behavioral handoff. You must confirm that your headline attracts the right audience, your floor plan facilitates natural movement, your product trial proves value rapidly, and your staff captures accurate buyer data. Validating these touchpoints in isolation is not enough. You need to observe how they function together when visitors are tired, distracted, and surrounded by competing noise.
Formative testing provides the foundation for this systematic evaluation. In product design and user research, formative testing identifies operational flaws and usability friction during the development phase. According to usability research by the Nielsen Norman Group, testing with as few as five representative users can uncover approximately 85 percent of usability problems in an interface before launch. Applying this methodology to physical activations allows trade show teams to uncover fundamental design and messaging errors through rapid, low-cost iterations before committing to expensive production builds.
Once formative iterations resolve baseline friction, summative testing verifies performance against commercial targets. Summative evaluations utilize structured simulations and pilot deployments to measure throughput, dwell time, qualification accuracy, and staff adherence. By establishing a rigorous pre-launch testing protocol, field marketing directors eliminate guesswork and create a repeatable blueprint for event execution. You can integrate these operational checks directly into the complete guide to planning a high-performance trade show activation to ensure team alignment.
Testing requires clear parameters rather than subjective opinions about aesthetic preferences. Every layout adjustment, graphic update, and script revision should begin with a structured hypothesis that defines the expected behavioral outcome.
A valid activation hypothesis contains five distinct elements:
For example, a enterprise software brand might state: "If we replace our product category headline with a specific operational outcome on the primary aisle banner, then the percentage of target operations directors who stop and correctly identify our core capability will increase from 20 percent to 50 percent during five-second comprehension tests." This hypothesis isolates a single variable, establishes an observable target, and provides a clear standard for production decisions.
Another common hypothesis focuses on engagement depth: "If our staff opens conversations with a specific pain-point diagnostic question rather than a general greeting, the proportion of booth conversations that advance to a completed product demonstration will rise by 25 percent." Testing operational statements like these prevents teams from debating subjective creative tastes. Instead, it anchors every pre-event decision in measurable human behavior.
Trade show attendees make split-second decisions as they walk down crowded aisles. Research published by the Center for Exhibition Industry Research shows that attendees attend exhibitions with specific business objectives and actively seek out subject matter experts to help them solve operational challenges. If your booth graphics fail to communicate your core value within seconds, qualified buyers will continue walking toward your competitors.
The five-second test measures how quickly an unfamiliar prospect understands your core message. Present a digital rendering, physical printout, or scale mock-up of your primary booth graphic to a test participant for exactly five seconds. Remove the visual and ask three standardized diagnostic questions:
If participants cannot answer these questions accurately without prompting, your headline is too complex, too vague, or buried beneath secondary design elements. Test participants must represent your target buyer profile rather than internal colleagues who already understand your product portfolio.
Recognition occurs when a prospect identifies your brand name after seeing a list of options. Recall occurs when a prospect can articulate your unique value proposition without any visual aids or hints. Unaided recall is a significantly higher standard, but it represents the true mental durability of your message on a loud expo floor.
Conduct recall assessments by interviewing test participants fifteen minutes after exposing them to competing booth mock-ups. If participants remember bright colors or unusual structures but cannot recall what business outcome you deliver, the visual identity is distracting from the commercial proposition. Streamline the typography, increase the contrast between text and background, and elevate the primary customer benefit above technical feature lists.
Booth graphics never exist in isolation. They compete against flashing digital screens, overhead rigging, hanging aisle signs, and neighboring brand installations. A peer-reviewed study examining trade show booth design and visual attention found that distinct three-dimensional structural elements such as architectural towers, overhead canopies, and dedicated interaction zones draw substantially more visual focus than flat wallpaper graphics and passive digital screens.
Simulate environmental clutter by placing your proposed graphics within a panoramic photographic composite of a live trade show hall. Evaluate whether your core message remains legible from fifteen feet away when surrounded by typical visual distractions. Check sightlines from multiple approach angles to confirm that supporting pillars, hanging lights, and staff positioning do not block primary brand assets.
A trade show booth functions as a commercial servicescape where physical design directly influences human behavior. An exhibition study published by the International Association of Exhibitions and Events applied servicescape principles to trade show floors, demonstrating that spatial layouts, lighting, equipment placement, and physical comfort significantly impact how exhibitors interact with attendees and achieve operational goals. A poorly planned layout creates physical resistance, while an optimized space guides visitors naturally toward conversation and qualification zones.
Virtual walkthroughs and architectural renderings often distort the true physical volume of a space. A booth that looks spacious on a computer screen can become congested once you add counters, trash receptacles, stools, equipment cases, and six active staff members.
Clear a floor space in your warehouse, office, or training facility that matches your exact booth footprint. Use colored masking tape to mark every structural boundary, demonstration counter, seating area, storage closet, and lead station. Require your team to walk through realistic interaction scenarios:
Observe where physical bottlenecks occur and measure aisle clearance dimensions. If staff members must repeatedly squeeze past each other or step into the aisle to let visitors pass, adjust the layout geometry immediately.
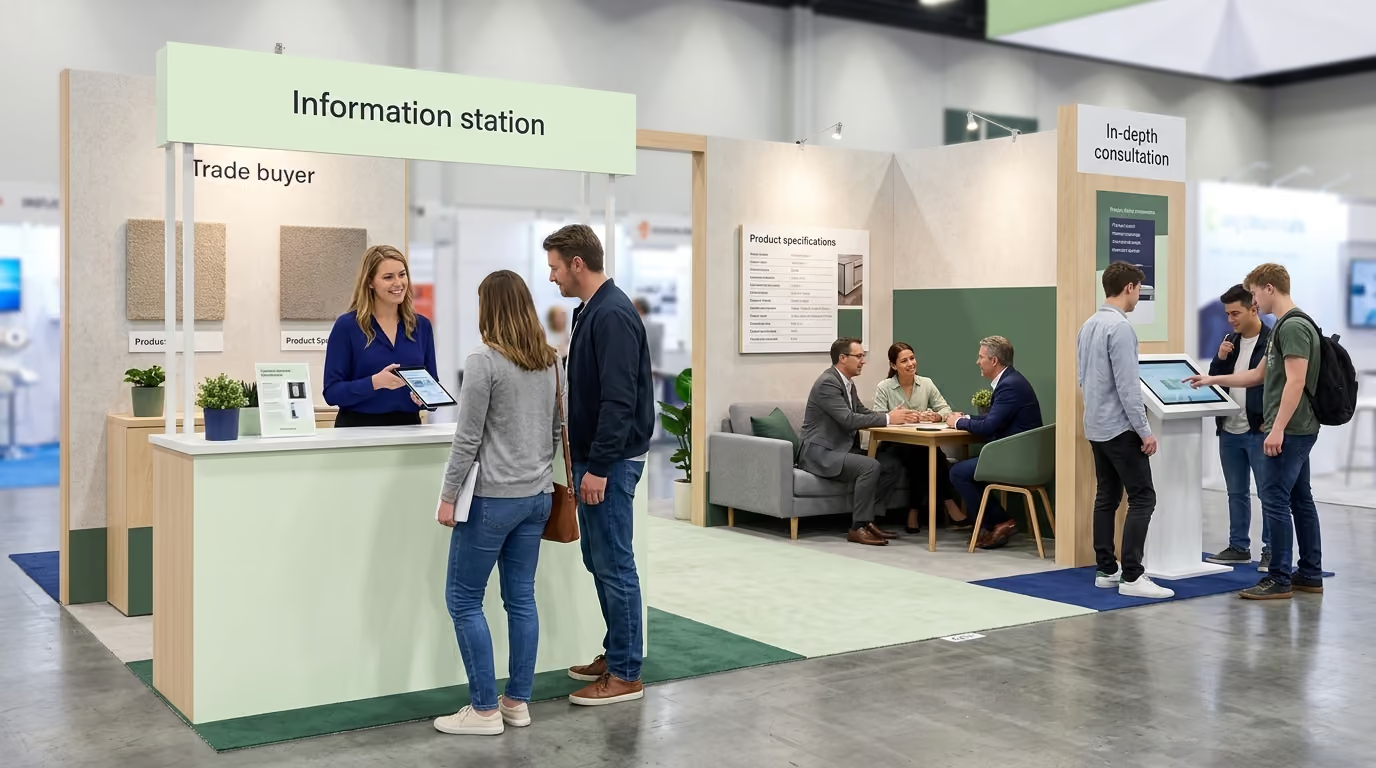
High-performance trade show architectures split the booth into three distinct behavioral zones:
Ensure that greeting counters do not act as physical barricades along the aisle edge. Positioning large reception desks directly at the perimeter creates psychological friction, causing cautious attendees to keep walking. Move large counters inward, create open sightlines from the aisle, and ensure visitors can easily exit the space whenever they choose. You can review structural planning considerations in the complete trade show activation budgeting guide to align your spatial footprint with cost allocations.
Product demonstrations must validate commercial claims quickly. If a demonstration takes four minutes of complex setup before delivering a tangible insight, busy decision-makers will abandon the interaction. Testing your demonstration protocol beforehand ensures that every interaction delivers rapid proof.
A high-converting product demonstration follows a structured, outcome-first framework:
Test your demonstration with unfamiliar internal or external participants to track the exact time required to reach the primary proof point. If the setup takes longer than forty-five seconds, cut secondary operational steps. Create a thirty-second rapid demonstration for peak traffic periods, accompanied by a comprehensive five-minute deep-dive protocol for high-intent technical evaluators.
Trade show networks are notoriously unreliable, and hardware components can fail under continuous daily use. You must subject your interactive demonstrations to rigorous failure-mode testing before shipping your crates.
Unplug the internet router during an active software workflow to evaluate offline caching and local performance. Let mobile devices run continuously on battery power for six hours to verify thermal stability and discharge rates under heavy usage. Establish a strict "minimum viable demonstration" protocol that allows staff to prove your value proposition using physical samples, static visual boards, or pre-recorded offline media if digital systems crash completely.
The most sophisticated booth architecture will fail if staff representatives act passively, deliver conflicting product messages, or fail to qualify prospects. Staff behavior must be engineered, practiced, and calibrated with the same operational precision as physical engineering assets.
Rigid, word-for-word scripts sound robotic and break down when visitors ask unexpected questions. Replace memorized scripts with a modular conversation framework containing three distinct components:
Run structured role-playing sessions before the show to practice these conversational pathways. Have team members portray distinct visitor personas, including rushed executives, junior researchers, direct competitors, and dissatisfied current clients. Evaluate how smoothly staff navigate these interactions and redirect off-topic inquiries.
Inconsistent lead scoring is a major cause of post-event pipeline breakdown. If one representative marks every casual visitor as a hot prospect while another representative only flags enterprise buyers ready to sign immediately, post-show reporting becomes distorted.
Calibrate your field team around objective, observable qualification tiers:
Conduct qualification calibration drills where the entire team reviews identical simulated prospect interactions. Compare individual scoring sheets, resolve discrepancies, and align the team on standardized evaluation standards. Ensuring your field staff knows how to handle varied commercial scenarios is central to winning retail distribution through trade show activations where retail buyers expect rapid, professional answers.
Lead capture should be a frictionless operational process that supports your commercial goals. Complex forms with excessive data fields cause high abandonment rates and frustrate visitors. Conversely, capturing raw badge scans without contextual notes produces low-value contact lists that sales teams inevitably ignore.
Progressive capture workflows balance speed with data depth. Design your digital capture interface to collect necessary baseline data in seconds, while allowing staff to append qualitative operational notes when speaking with high-intent buyers.
Test your digital lead capture forms across three operational criteria:
Run form usability tests under high-stress conditions. Introduce background noise, simulate weak cellular connections, and evaluate how the capture software handles offline data caching. Ensure that captured leads sync automatically with your central CRM without generating duplicate records or overwriting existing client histories.
A lead capture workflow does not end at the badge scanner. The true test of your capture infrastructure is how quickly and accurately data moves from the trade show floor into active sales pipelines. You can review advanced integration techniques in our analysis of exhibitors integrating pipeline-driven lead capture to streamline backend sync operations.
Conduct end-to-end sync audits two weeks before the event:
Fixing data-mapping errors before the event prevents the operational delays that often stall post-show outreach.
Executing a flawless trade show activation requires rigorous rehearsals. Conduct five sequential simulation rounds during the final four weeks before shipping event assets. Each round evaluates a specific operational layer, allowing your team to identify and resolve systemic bottlenecks systematically.
Measuring trade show performance requires tracking both leading behavioral indicators on the floor and lagging commercial milestones in your sales pipeline. Tracking isolated metrics like gross badge scans creates a false sense of success. True Return on Investment emerges from measuring conversion velocity across each stage of the activation funnel.
Establishing clear definitions for these metrics before the event ensures unbiased performance reporting. It allows marketing leaders to demonstrate concrete commercial impact to executive leadership with total confidence.
A fast-growing natural snack brand prepared to launch a premium product line at a major national food industry trade show. The primary business objective was securing distribution agreements across regional supermarket chains while driving high consumer trial volume.
Initial creative concepts featured an elaborate, fully enclosed experiential kitchen structure designed to showcase culinary recipes. During Simulation Round 2, the team ran physical flow tests in a warehouse mock-up. The tape simulation revealed that the enclosed counter design created severe congestion, limiting visitor throughput to forty people per hour. Furthermore, Simulation Round 1 revealed that retail category buyers could not identify the product's primary retail packaging or shelf margin benefits from the aisle.
The team executed rapid pre-launch iterations:
We design mobile activations and roadshows that accelerate consumer trial, build trust, and boost retail velocity during 90-day product launch windows. Our structured approach transforms initial product trial into sustained consumer confidence and retail performance. By applying these testing and spatial optimization principles before the trade show opened, the brand achieved exceptional commercial outcomes. The activation generated a 210 percent increase in qualified retail buyer meetings compared to the previous year, secured commitments from four major grocery chains, and maintained an average capture-to-sync timeline of under four hours throughout the three-day event. When brands plan broad retail rollouts, they can apply similar structural efficiencies through modular roadshow designs built for multi-channel field deployment across multiple markets.
Testing does not end when the exhibition begins. Treat the live trade show floor as a continuous optimization environment where small, real-time adjustments improve commercial yield each day.
Hold fifteen-minute operational briefings with your booth staff at the beginning and end of each show day:
If data shows that a specific demonstration station is underperforming, reposition signage, adjust lighting, or modify the opening script during the morning briefing. If one staff member consistently captures high-converting opportunities, have them share their conversational techniques with the broader team.
Schedule a formal post-mortem review with marketing and sales leadership within fourteen days of the event. Evaluate both quantitative pipeline data and qualitative staff feedback across four primary pillars:
Documenting these operational insights creates institutional knowledge. It ensures that every trade show activation builds upon validated data, making subsequent field campaigns faster to plan, cheaper to refine, and significantly more profitable to execute. For long-term portfolio planning, teams can leverage these findings within a strategic playbook for product launches at trade shows to establish predictable commercial returns.
When planning major industry events, revisit this resource ninety days before your ship date to guide your structural mock-ups, messaging tests, and staff simulations.
Systematic pre-launch testing replaces event-day chaos with disciplined operational control, turning your physical booth into a predictable, revenue-generating engine.

30 Years Experiential & Retail Activation Partner for CPG & Beverage Brands | Multi-Market Demos, Roadshows & Costco/Club Programs That Actually Sell