Robbie Thain
Founder, CEO

While digital advertising drives search visibility, integrating retail media with in-store sampling unifies physical product trials to maximize shelf.
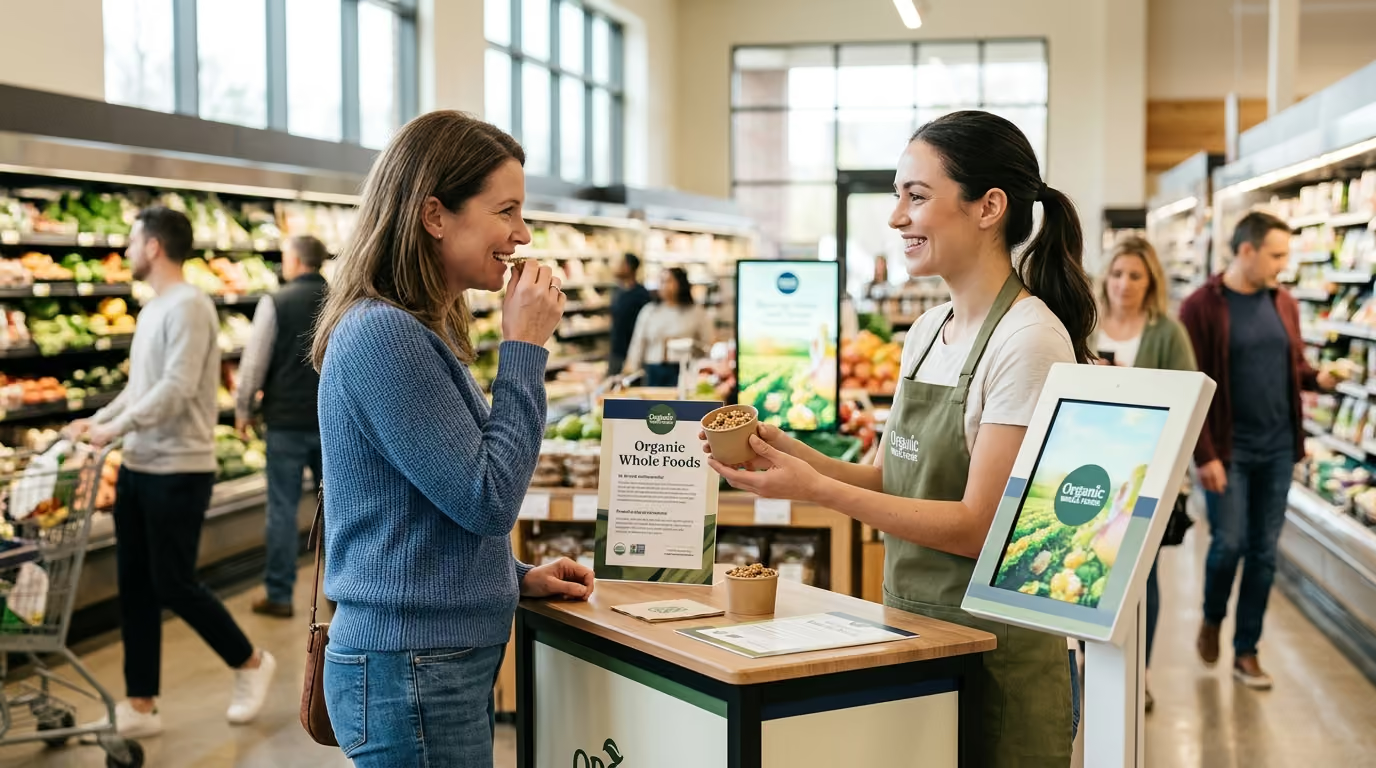
Connecting retail media with in-store sampling transforms digital advertising from isolated impressions into verifiable physical conversions. Brands that combine retailer first-party audiences with live product trial build measurable shopper journeys that expand categories, lower acquisition costs, and prove true incrementality at the shelf.
On a typical Saturday afternoon in a high-volume grocery store, the disconnect between digital media and physical reality is glaring. A brand spends thousands of dollars serving mobile display ads and sponsored search banners to shoppers within a three-mile radius. Meanwhile, fifty feet inside the entrance, an unbriefed third-party demo worker stands behind a folding table, handing out room-temperature samples of a completely different product variation to anyone walking past. The digital campaign tracks impressions, the demo log records hand counts, and neither team knows whether an exposed shopper ever tasted the product or bought a single unit. This operational divide wastes marketing dollars and leaves brand leaders guessing about their true Return on Investment (ROI).
Retail media networks represent one of the fastest growing channels in modern marketing. Research from the Interactive Advertising Bureau (IAB) projected retail media growth of 15.6% in 2025, more than twice the projected overall digital advertising growth rate of 7.3%. Forecasts from eMarketer project United States retail media spending to reach $58.79 billion in 2025 and $69.33 billion in 2026.
Retail media encompasses advertising inventory and audience access managed directly by retailers. According to industry guidance from IAB Europe, retail media operates across three primary environments:
Despite the rapid expansion of retail media spending, physical store engagement remains the primary venue where grocery transactions occur. Forecast data from eMarketer indicated that in-store retail media represented less than 1% of total United States retail media sales in 2024. Most digital retail media spending remains concentrated on website search and display banners. In fact, IAB Europe reported that more than 90% of retail media buyers allocate at least 41% of their digital retail media budgets to on-site digital formats.
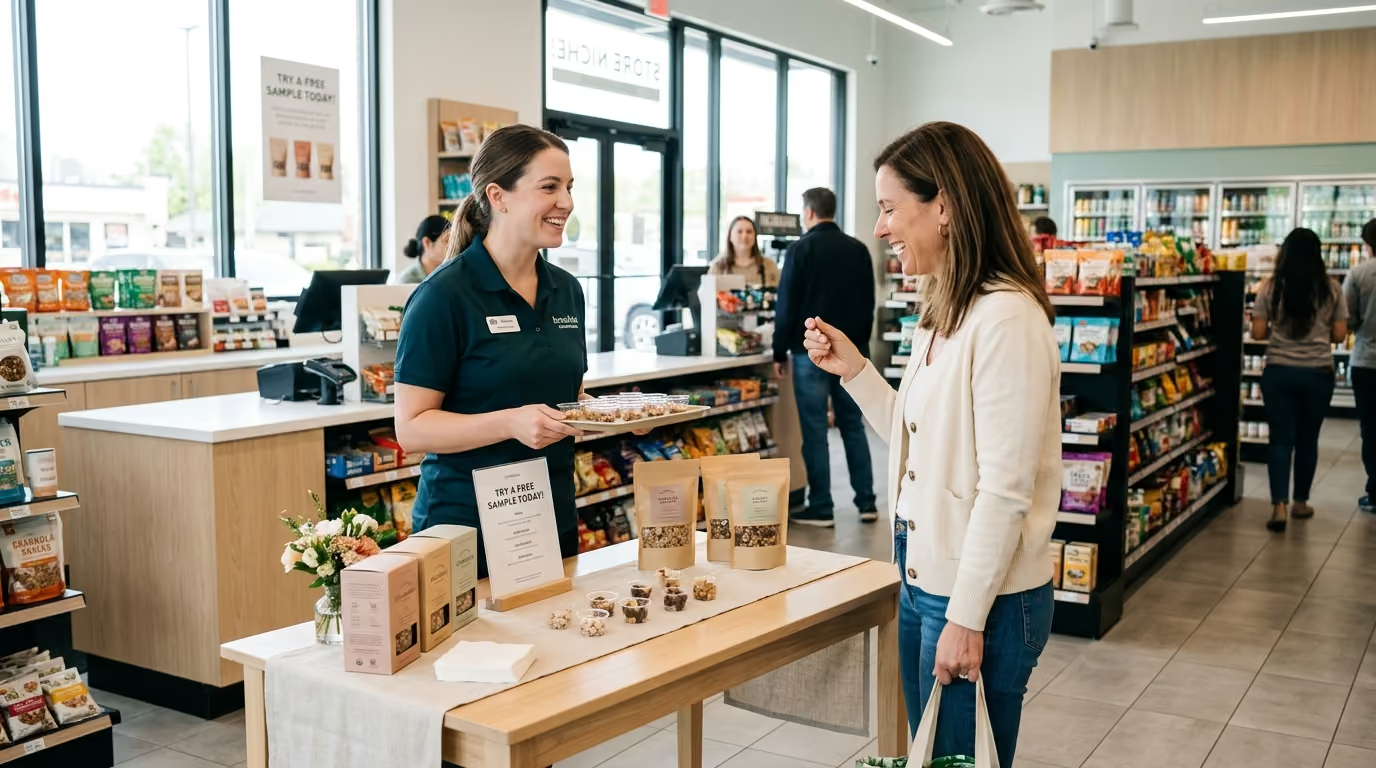
In-store sampling serves as both a promotional sales driver and an experiential marketing channel. A physical tasting or demonstration removes sensory risk at the exact location where the shopper makes a purchasing decision. When brands operate digital media and physical trial in isolation, both tactics underperform. Integrating the two disciplines creates a unified sequence: target, invite, experience, purchase, identify, and retain. For brands seeking to connect these touchpoints, linking physical sampling to retail media performance establishes a reliable framework for field execution.
Digital advertising builds awareness and establishes purchase intent. It cannot replicate taste, aroma, skin feel, texture, or ease of preparation. A high-resolution image of a plant-based sausage or a premium sparkling beverage cannot answer whether a consumer will enjoy the flavor. Sampling directly resolves sensory hesitation.
A landmark study published in the Journal of Retailing by Chandukala, Dotson, and Liu analyzed six store-level scanner datasets across four distinct product categories. The researchers confirmed that in-store product sampling generates both immediate sales spikes and sustained, long-term sales lift. Crucially, the study proved that sampling produces a category-expansion effect rather than simple brand substitution. Instead of merely convincing a shopper to switch between two competing products, physical sampling brings new shoppers into the category and increases overall consumption volume.
The Journal of Retailing research also demonstrated that repeated sampling events for a single product generate a multiplicative increase in long-term sales performance. Conducting structured, sequential activations inside stores compounds trial effects over time.
Digital retail media enhances this physical activation by solving the efficiency constraints of field demos. In-store sampling is naturally constrained by staff availability, store operating hours, inventory levels, and geographic reach. Indiscriminately running sampling events in every retail location drains capital quickly.
By leveraging retailer first-party audience data, brands can focus physical sampling inside locations with high concentrations of target consumers. Brands can identify stores featuring high category sales, strong loyalty card penetration, and large populations of lapsed buyers. By activating first-party shopper data inside stores, brands transform sampling from a broad awareness tactic into a targeted conversion engine.
Executing a connected activation requires operational alignment across five distinct operational layers. If any single layer fails, the campaign loses measurable attribution and conversion efficiency.
The campaign must begin with precise shopper segmentation using retailer loyalty data. The Media Rating Council (MRC) and IAB retail media measurement guidelines identify demographic, geographic, behavioral, and psychographic features as core audience inputs.
CPG brands should divide their audience targets into actionable cohorts:
Shopper receptivity changes throughout the purchasing cycle. The campaign must sequence digital media delivery to match physical store visits.
The digital advertisement and the physical sampling station must share visual identity, claims, and promotional pricing. If an on-site search ad promotes a high-protein claim while the sampling table promotes low sugar, shoppers experience cognitive friction.
Ensure packaging imagery, color palettes, taglines, and price promotions match across every digital banner, physical table skirt, and shelf blade. If a digital coupon offers two dollars off, the brand ambassadors must actively instruct shoppers on how to scan and redeem the discount during trial.
The sampling station must be designed for rapid trial and frictionless conversion. Stations must be placed in close proximity to the home shelf or a secondary endcap display.
Ambassadors must receive thorough training on product preparation, dietary guidelines, flavor profiles, and stock monitoring. The physical setup must include dedicated trash receptacles, clear allergen labeling, and branded signage that guides the consumer directly to the product shelf.
The final layer establishes the mechanisms to prove incremental return. Teams must establish clean control groups and matched-store holdouts before media spend begins. Tracking must capture media delivery metrics, sampling operational counts, point-of-sale scanner data, and longitudinal loyalty transactions.
To execute this five-layer model effectively, brands must guide consumers through a five-stage connected shopper journey.
The discovery stage builds awareness and intent through retailer-owned and off-site digital media. Sponsored product search placements capture shoppers searching for generic category terms like "organic energy drink" or "gluten-free pasta." Programmatic display ads target verified category buyers across external websites, directing them to the retailer digital storefront.
Key metrics in this stage include unique reached shoppers, search click-through rates, and branded search query lift within the retailer ecosystem.
The decision stage gives consumers a clear reason to visit a participating physical store. Digital ads incorporate localized calls to action, including specific event dates, tasting hours, and participating store addresses. Retailer mobile apps can display dedicated event banners or digital wallet incentives that activate upon entering the physical store.
Key metrics include store-locator lookups, event page pageviews, and digital offer clip rates.
The physical experience resolves product uncertainty through sensory interaction. When the shopper arrives at the designated aisle, the sampling station provides immediate trial, taste evaluation, and product education.
Brand ambassadors answer questions regarding ingredients, preparation techniques, and sourcing practices. Cleanliness, proper product temperature, and positive interpersonal engagement dictate whether trial leads to purchase intent.
Key metrics include total samples distributed, consumer interaction time, and qualitative consumer feedback logs.
Conversion reduces the friction between product tasting and physical checkout. The brand ambassador directs the shopper to an adjacent endcap or shelf location stocked with fresh inventory.
Point-of-sale promotional materials reinforce the value proposition. Shoppers can scan a digital coupon, leverage temporary price reductions, or participate in multi-buy discounts.
Key metrics include same-day scanner units, event-day sales lift over baseline, and immediate coupon redemption rates.
The post-purchase stage turns a single trial into sustained repeat purchasing. Packaging, sample cards, and digital receipts feature quick response mechanisms that deliver value-added content.
According to a 2024 consumer benchmark survey conducted by 1WorldSync, 61% of consumers reported scanning a product QR code after making a purchase. Shoppers actively use post-purchase QR codes to access cooking recipes, usage guides, and brand loyalty rewards.
Key metrics include repeat purchase rates at four, eight, and twelve weeks, loyalty club signups, and customer acquisition cost per retained household.
Selecting retail stores purely based on foot traffic leads to poor conversion and wasted capital. High foot traffic does not guarantee audience fit, adequate inventory, or measurement capability. Brands must match specific target audiences with stores that meet precise operational criteria.
When a brand introduces a new flavor, size, or formulation, existing brand buyers represent the fastest path to volume. These shoppers already trust the core brand but need a sensory prompt to expand their basket.
Select top-tier retail stores that rank in the upper quartile for baseline brand sales. Deploy on-site retail search ads targeting brand keywords, and schedule sampling stations directly adjacent to the main shelf presence. The primary metric is incremental units per existing buyer.
Winning market share requires converting consumers who regularly purchase competing products in the same aisle.
Select retail locations where category velocity is high but the focal brand underperforms relative to market share leaders. Deploy off-site competitive conquesting campaigns using retailer loyalty segments. In the store, ambassadors should conduct comparative tasting or focus on distinct ingredient differentiators. The primary metric is new-to-brand household acquisition.
Lapsed buyers represent consumers who purchased the brand historically but discontinued buying over the previous six to twelve months.
Identify stores where the historical buyer count remains high but recent velocity has dropped. Use personalized retailer loyalty emails and app notifications featuring special return offers. The sampling table should focus on product reformulations, updated packaging, or fresh seasonal uses. The primary metric is thirty-day customer reactivation rate.
For emerging categories like non-alcoholic spirits or functional beverages, many shoppers find the product space unfamiliar or intimidating.
Select retail stores located in demographic trade areas that show high purchasing volume in adjacent wellness categories. Deploy educational video ads across connected television and social channels explaining the primary use case. In the physical store, ambassadors should offer simple usage demonstrations, approachable flavor descriptions, and beginner recipes. The primary metric is overall category volume expansion.
Retailers maintain dedicated tiers of high-spending loyalty members who generate significant basket value across the store.
Select retail locations with high loyalty card scan rates and active digital app engagement. Deliver exclusive preview invitations and personalized high-value digital coupons through the retailer app. The sampling station should offer premium presentations, gift-with-purchase incentives, or multi-pack options. The primary metric is net incremental gross profit.
Quick response codes act as the digital bridge connecting physical product packaging and event signage back to digital systems. However, a QR code that simply directs a user to a generic corporate homepage frustrates consumers and breaks attribution.
A 2024 consumer study by 1WorldSync revealed that 64% of consumers scan QR codes while actively shopping in physical retail stores. The survey also revealed that 75% of frequent online grocery shoppers scan QR codes during their brick-and-mortar store visits. These shoppers scan codes specifically to look up detailed ingredient lists, nutritional facts, pricing comparisons, and verified customer reviews.
To maintain clean data tracking across the campaign, every physical touchpoint must feature a distinct, dynamically routed QR code.
Construct unique destination URLs for each individual placement:
Each QR destination link must contain tracking parameters indicating the retailer chain, store identifier, media campaign name, physical placement type, and timestamp. The landing page must load in under two seconds on mobile cellular connections and must never force an immediate app download or complex account registration before delivering value.
Structure the landing page destination around solving an immediate shopper need:
Avoid these execution mistakes when implementing QR codes:
Measuring integrated campaigns requires separating media delivery, physical store footfall, transactional volume, and true incremental lift. Retailers and brand leaders must evaluate multiple data layers to establish causality.
Capture baseline digital advertising delivery metrics across all retailer-owned and off-site channels. Tracking must record total served impressions, unique reached households, frequency, viewability rates, and search click-through rates. These metrics confirm whether the digital investment successfully generated awareness in the target trade area.
Counting total store entrance footfall does not accurately reflect how many consumers walked past a specific sampling activation. The IAB and MRC retail media measurement guidelines recommend dividing physical retail stores into standardized zones and measuring traffic specifically within the relevant activation area.
Track the following physical metrics:
For teams refining their reporting standards, tracking core sampling metrics beyond headcount ensures field data translates directly into operational insights.
Gather store-level point-of-sale scanner data for the activation day and surrounding weeks. Key data points include:
Attributed sales must not be confused with incremental sales. A consumer who planned to buy the product regardless of the demo does not represent an incremental conversion.
To prove causality, deploy matched-store test-and-control methodologies:
Analyzing variance across these four cells using difference-in-differences statistical modeling isolates the true incremental lift generated by connecting the channels. Exploring specialized retail media incrementality measurement tools provides clear visibility into net new revenue generation.
Evaluating an activation solely on same-day scanner sales significantly understates performance. The Journal of Retailing study proved that in-store sampling generates substantial long-term carryover effects.
Structure reporting across five distinct measurement windows:
Published summaries of the historical R.I.S.E. in-store sampling research indicate that product sampling can generate an average event-day sales lift of +475% across diverse grocery categories. The same summary reported an average cumulative trial increase of +58% and a cumulative sales lift of +74% over a twenty-week post-event tracking window. While individual brand results vary based on category dynamics and execution quality, longitudinal tracking is necessary to capture total financial return.
Executing an integrated retail media and sampling campaign requires meticulous operational coordination between digital marketing teams, field operations, store managers, and retail media network managers.
Building an integrated budget requires a full-funnel resource allocation model rather than managing digital media and field events from separate, unaligned budgets.
A comprehensive integration budget must account for five core operational buckets:
To determine whether to expand an integrated campaign to additional retail doors or market regions, brand managers should apply a constrained profit decision rule based on the Journal of Retailing optimization model.
Allocate capital to an additional store or audience cohort only when the expected incremental gross profit exceeds the combined marginal cost of digital media, field staffing, product samples, and data measurement.
$$\text{Expected Incremental Gross Profit} > \text{Cost}{\text{media}} + \text{Cost}{\text{sampling}} + \text{Cost}_{\text{measurement}}$$
Where:
If a proposed retail location lacks sufficient category traffic or baseline sales velocity to satisfy this equation, cancel the physical demo and redirect media spend to higher-density locations. For deeper insights into financial modeling, proving retail demo return on investment provides practical templates for retail operators.
Connecting digital media with physical sampling produces measurable business outcomes across diverse retail situations.
A growing plant-based food company launched a premium culinary line across five hundred regional grocery locations. Consumer research indicated that while shoppers were interested in plant-based alternatives, they hesitated to spend six dollars per tub due to concerns over texture and culinary melt performance.
Our team designed an integrated ninety-day activation plan. Four days prior to weekend sampling events, we launched localized sponsored search ads across the retailer network, targeting search terms like "dairy-free butter" and "vegan baking." Off-site digital video ads demonstrated professional chefs melting the product in pan sauces, geo-targeted to households within five miles of participating locations.
In the stores, our field ambassadors managed live cooking stations at aisle endcaps, searing fresh crostini in the plant-based product and offering immediate tastings. Each consumer received a branded card featuring a unique QR code. Scanning the QR code delivered three thirty-minute dinner recipes and clipped a one-dollar digital coupon directly to the shopper loyalty account.
A Vice President of Marketing reflected on our partnership: "Robbie, it was a pleasure working with you and your team. You turned our launch into an experience that connected with shoppers and built lasting excitement for our brand. We are already looking forward to the next project together."
Our team created a launch experience that connected with retail shoppers and generated sustained momentum across all participating store divisions. Post-campaign scanner data revealed an immediate +380% event-day sales lift over baseline. More importantly, twelve-week longitudinal loyalty data proved a +42% sustained increase in baseline velocity and a +64% new-to-brand acquisition rate across the test stores compared to matched non-sampling control stores.
Brand leaders should adjust their campaign structure based on specific commercial goals:
Even well-funded campaigns encounter operational failures if field execution is neglected. Brand managers must actively identify and mitigate these core risks.
Serving one million digital ad impressions does not mean consumers will attend an in-store demo. Always track intermediary conversion steps, including store locator queries, digital offer clips, and physical zone dwell time.
A consumer accepting a free sample cup does not equal an acquired customer. Handing out five hundred samples means very little if the table is positioned fifty yards away from inventory or if the ambassador fails to ask for the sale. Track the sample-to-purchase conversion ratio by auditing immediate shelf sell-through against distribution counts.
Driving heavy digital media and high sampling volume into a store with only twelve units on the shelf leads to immediate stockouts. An out-of-stock event frustrates shoppers, wastes ad spend, and distorts measurement data. Establish strict inventory thresholds and suppress digital media automatically if store inventory drops below minimum safety buffers.
Calculating campaign return purely on units sold during a four-hour demo window severely misrepresents commercial impact. In-store sampling generates significant delayed purchasing and long-term brand equity. Evaluate campaigns across twelve to twenty-week reporting windows to capture total lifecycle value.
Integrated campaigns frequently collect mobile device data, loyalty IDs, and online engagement parameters. Ensure all digital landing pages, QR destinations, and loyalty opt-in flows comply with relevant state privacy statutes and retailer data governance frameworks. Use data minimization practices and clear opt-in disclosures.
Revisit this field guide whenever your brand initiates a retail product launch, negotiates joint business plans with retail media networks, or restructures field marketing budgets. Mastering the operational link between digital retail media and in-store sampling turns live brand experiences into a repeatable, measurable competitive advantage.

30 Years Experiential & Retail Activation Partner for CPG & Beverage Brands | Multi-Market Demos, Roadshows & Costco/Club Programs That Actually Sell