Robbie Thain
Founder, CEO

Four strategic planning layers help consumer brands align field merchandising, retail media, and dynamic demand triggers into a profitable promotional.

A disciplined retail activation calendar connects shopper missions, promotional timing, and dynamic environmental triggers into a predictable revenue engine. By aligning field execution with retailer schedules and consumer purchase cycles, brand teams can turn physical store traffic into sustained commercial growth.
Every weekend, thousands of brand activations unfold across grocery aisles, club stores, and mass retailers in absolute chaos. Field teams arrive at retail locations only to discover that promised inventory sits trapped on pallets in the stockroom. Brand ambassadors set up demonstration tables in low-traffic corners, far away from primary shelf placements, because department managers received no advance communication. Shoppers rush past generic weekend displays without looking, focused on specific shopping missions that the activation completely ignores. Meanwhile, regional managers approve heavy temporary price discounts that coincide with stock-outs, creating frustration for store staff and consumers alike.
These operational breakdowns stem from a fundamental planning error. Too many marketing teams treat their retail activation calendar as a decorative schedule of national holidays and arbitrary weekend bookings. They pick dates based on generic calendar moments rather than validated shopper demand windows. A holiday on a calendar does not guarantee foot traffic, and high foot traffic does not guarantee purchase intent. When field marketing operates in a vacuum, separated from retail supply chains and shopper behavioral context, live activations waste budget and damage retailer relationships.
The cost of this disconnected approach is severe. Consumer packaged goods brands spend substantial capital on sample production, agency fees, and field labor, only to generate zero measurable baseline lift. When an activation ends, brand directors struggle to prove whether sales spikes represented true incremental volume or simple baseline borrowing. Without structured timing, activations fail to capture shoppers when they are most receptive to product trial. To fix this, marketing leaders need a systematic planning framework that coordinates operational readiness with real-world consumer behavior.
A high-performing retail activation calendar functions as a strategic decision system rather than a static timeline. It orchestrates four distinct dimensions of timing to ensure maximum commercial return. First, consumer timing identifies when a shopper experiences a specific physical or psychological need. Second, retail timing tracks when physical stores and retail media networks generate peak shopper foot traffic. Third, brand timing ensures inventory availability, packaging readiness, and promotional pricing alignment. Fourth, operational timing confirms that field staffing, demonstration permits, logistics, and reporting mechanisms are fully ready for execution.
To structure these timing dimensions, brand teams should organize their planning across a four-level hierarchy.
Annual strategic moments represent the macro commercial periods that anchor national retail commerce. These include the winter holiday corridor, New Year resolution cycles, Valentine's Day, spring breaks, summer travel windows, back-to-school periods, and Thanksgiving week. The National Retail Federation defines the winter holiday season as November 1 through December 31, yet consumer purchasing behavior starts well before November. High-performing brand teams map these macro moments nine to twelve months in advance. This advance visibility ensures production runs, packaging variations, and master retail co-op agreements align with major holiday surges.
Seasonal demand windows reflect broad shifts in human behavior, lifestyle habits, and weather conditions rather than rigid dates. Examples include the first warm spring weekends, mid-summer heat waves, autumn allergy periods, backyard grilling season, and winter illness spikes. Analysis from NIQ demonstrates that seasonal products experience dramatically higher sales velocity during their relevant natural season than during baseline periods. Capturing these windows requires flexible scheduling, because seasonal transitions occur at different times across geographic markets. A spring beverage campaign must roll out across southern states weeks before northern markets thaw.
Retailer-specific events govern the commercial rhythms of individual merchant partners. These include category resets, digital circular features, anniversary sales, loyalty member discount days, endcap rotations, and store grand openings. Aligning with retailer schedules is vital because physical shelf support amplifies experiential marketing. In our experience managing multi-market campaigns, coordinating field demonstration dates with retailer circular drops can double product velocity. When field marketing plans fail to synchronize with merchant category resets, brands miss high-value endcap positioning and retail media co-investment.
Behavioral shopping missions represent the most granular and profitable layer of calendar planning. These occasions reflect what individual consumers want to accomplish during a specific store trip. Examples include finding quick morning breakfast options, stocking up for a youth sports tournament, purchasing party appetizers, or discovering healthy snacks. Behavioral missions translate directly into effective demonstration scripts, bundle configurations, and sampling locations. When a retail activation directly answers an immediate shopping mission, the conversion rate from trial to purchase increases substantially.
To build an activation calendar that converts foot traffic into pipeline, marketers must master occasion architecture. An occasion is the specific circumstance in which a consumer interacts with, consumes, or shares a product. A functional beverage brand might serve a morning productivity occasion, a mid-afternoon energy slump occasion, and a weekend workout recovery occasion. Each occasion requires different messaging, distinct sample portioning, and specific calendar timing. Mapping these consumption moments allows brand teams to deploy their field resources when consumer receptivity peaks.
Shopping missions dictate how consumers navigate physical store environments. Marketers should classify retail visits into distinct behavioral categories:
Triggers act as the catalysts that activate these shopping missions. Calendar-based triggers include scheduled events like school start dates, paydays, and sports championships. Dynamic triggers include sudden forecast shifts, local community events, and digital promotional drops. By tracking how external triggers spark specific shopping missions, brand managers can deploy field teams with surgical precision. For example, scheduling portable snack demonstrations on Friday afternoons directly targets parents preparing for weekend youth sports tournaments.
Understanding shopper behavior also clarifies the strategic difference between conversion sampling and category-entry sampling. Conversion sampling targets consumers who already shop the product category, encouraging them to switch from a competitor or upgrade to a premium line extension. Category-entry sampling introduces unfamiliar product formats or usage occasions to non-users, drawing new households into the category. Academic research published in the Journal of Retailing shows that product sampling frequently drives broad category expansion rather than simple brand substitution. Designing calendar activations around specific missions ensures your field teams target the right shopper segment with the correct commercial objective.
Weather is not an uncontrollable post-event excuse for poor performance. It is a predictable, dynamic catalyst that brand teams should build into their activation calendars. Research from the Federal Reserve Bank of San Francisco confirms that weather variations directly influence retail sales, store traffic patterns, and consumer channel selection. Furthermore, analysis from Planalytics cited by the National Retail Federation indicates that 90% of weather-based sales volatility stems from day-to-day fluctuations in temperature and precipitation.
Weather shifts alter shopping behavior across three distinct operational layers. First, precipitation and severe storms dictate physical store access and foot traffic density. Second, sudden temperature changes shift immediate consumer product desires, turning cold beverage demand into hot comfort food demand overnight. Third, seasonal weather anomalies shift the timing of extended demand windows, advancing or delaying categories like sun care, allergy relief, and outdoor entertaining. Research on consumer spending reveals that improved weather conditions, including higher visibility and pleasant temperatures, generate measurable increases in total basket spend.
To harness weather dynamics, brands should establish store cluster rules based on micro-climates and geographic characteristics. A high-density urban store near mass transit routes experiences different weather-related foot traffic patterns than a suburban location with covered parking. Field marketing leaders should build dynamic activation triggers into their master calendar. When meteorological forecasts predict a regional heat wave, automated triggers should adjust demonstration flighting, move cold-beverage sampling forward, and notify retail field merchandisers to audit refrigerated secondary displays.
Managing dynamic weather layers requires robust operational discipline. Teams must develop clear contingency plans for outdoor and indoor sampling events. If unseasonable rain suppresses physical foot traffic at suburban retail parks, brands can pivot staffing hours toward high-density urban grocery centers or adjust demo formats to emphasize indoor comfort themes. Treating weather as a dynamic planning layer transforms environmental volatility into a distinct competitive advantage.
Major calendar moments offer unmatched foot traffic, but capturing commercial value requires disciplined staging. Too many brands compress their holiday marketing into a single promotional weekend, creating severe execution bottlenecks. Consumer research from the National Retail Federation shows that over half of holiday shoppers begin researching and purchasing items in October or earlier, while more than 60% complete their shopping in late December. Staging activations across multi-week horizons captures consumers during early discovery, mid-season purchasing, and late replenishment phases.
Holiday execution must also extend past the main event date. Survey data indicates that 70% of consumers plan to shop in the week following December 25, driven by holiday clearance discounts, returns, and gift card redemptions. An effective activation calendar schedules secondary sampling flights during this post-holiday window to turn one-time holiday shoppers into long-term brand buyers. Brands should deploy our retail product launch activation framework to structure multi-phase product introductions across high-volume retail holidays.
Cultural moments and heritage celebrations demand operational authenticity and deep consumer relevance. Superficial decorative themes generate consumer cynicism and waste marketing spend. Brands must evaluate whether their product plays a natural, functional role in cultural traditions, family gatherings, or celebratory meals. When building activations around moments like Lunar New Year, Cinco de Mayo, or Juneteenth, marketing directors must ensure local store assortments, staff language capabilities, and product serving suggestions genuinely align with community practices.
Sports and entertainment events provide powerful shared gathering moments, but timing is everything. A common field error is activating on the day of a major championship game, when shoppers are already hosting gatherings at home. High-performing brands activate two to three days before kickoff, when consumers are actively shopping for party supplies, snacks, and beverages. By matching retail environments with shopper intent, field teams can cross-merchandise specialty snacks directly adjacent to deli counters, party platters, and beverage aisles during peak pre-game shopping hours.
Product sampling achieves its highest Return on Investment when integrated directly with in-store merchandising and retail media networks. Standalone sampling without retail display support creates fleeting awareness without driving immediate basket conversion. Conversely, price discounts without product demonstration often attract existing brand switchers rather than recruiting high-value, new-to-brand consumers. High-performing activation calendars coordinate attention, experience, and conversion mechanics into a synchronized retail event.
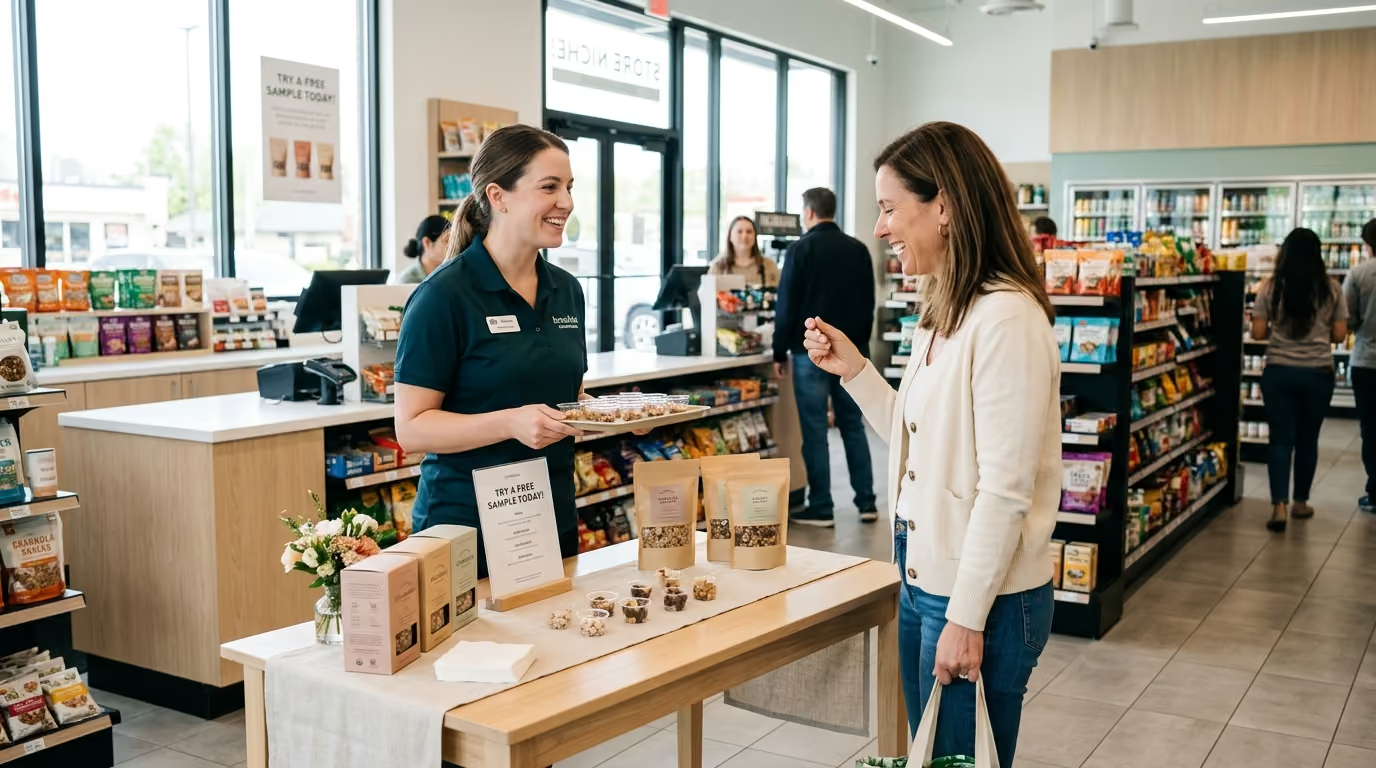
The physical location of a retail demonstration dramatically impacts shopper conversion rates. Industry retail studies indicate that sales conversion increases significantly when product demonstrations operate within 20 feet of the product's primary shelf or secondary display. Shoppers engaged by live demonstrations spend roughly 10% more time in-store, and featured products regularly maintain elevated sales velocity for weeks following the event. When brand ambassadors direct shoppers toward nearby endcaps loaded with promotional stock, trial converts directly into ring at the register.
Retail media networks provide the digital connective tissue for physical field activations. Brand managers should schedule targeted digital circular ads, app notifications, and proximity mobile media to run concurrently with physical sampling schedules. When a shopper receives a digital coupon while walking past an active demonstration table, friction disappears. Coordinating digital ad impressions with physical field staffing schedules ensures that paid marketing dollars drive qualified foot traffic directly toward active trial stations.
Merchandising compliance represents the final link in the conversion chain. Field marketing directors must establish strict inventory readiness gates before approving activation spend. If store inventory levels cannot support a minimum three-day sales surge, demonstration dates should be rescheduled. Ensuring that secondary displays, temporary price discounts, and promotional shelf tags are active before brand ambassadors arrive protects marketing capital and maximizes transaction volume.
Building an enterprise-grade activation calendar requires a disciplined, chronological execution playbook. Follow these seven operational phases to design and deploy your annual field strategy.
Define one non-negotiable commercial objective for each retail activation campaign:
Document the exact behavioral context of your target consumer base:
Populate a comprehensive master calendar capturing all relevant external commercial drivers:
Evaluate each potential activation window using an objective mathematical scoring formula:
$$\text{Opportunity Score} = \text{Relevance} \times \text{Traffic} \times \text{Product Fit} \times \text{Readiness} \times \text{Margin Potential}$$
Score each factor on a scale from 1 to 5 to eliminate subjective planning bias:
Match specific field marketing formats to validated consumer shopping objectives:
Execute a disciplined operational flighting timeline to ensure smooth field implementation:
Enforce a strict go/no-go readiness checklist before deploying field teams to retail stores:
Evaluating live field activations requires moving past simple headcount tallies and vanity foot traffic numbers. Marketing directors must establish a dual scorecard measuring both real-time operational execution (lead metrics) and sustained commercial profitability (lag metrics). Field teams need structured systems for building a field scorecard for live activations to connect daily store demos with enterprise financial reporting.
Lead metrics track field efficiency, operational compliance, and immediate consumer engagement during the demonstration:
Lag metrics evaluate post-event retail scan data to determine true financial incrementality and customer acquisition efficiency:
To measure commercial success accurately, brand analysts must apply standard mathematical formulas:
$$\text{Incremental Revenue} = \text{Actual Period Revenue} - \text{Expected Baseline Revenue}$$
$$\text{Incremental Gross Margin} = (\text{Incremental Revenue} \times \text{Gross Margin Rate}) - \text{Total Activation Costs}$$
$$\text{Cost Per Trial} = \frac{\text{Total Activation Cost}}{\text{Verified Samples Distributed}}$$
$$\text{Return on Investment} = \frac{\text{Incremental Gross Margin}}{\text{Total Activation Cost}}$$
Rigorous sampling research from PromoWorks and Knowledge Networks-PDI confirms that effective product sampling drives significant long-term commercial impact. In analyzed campaigns, sampled items achieved an average 475% same-day sales lift, while sampled consumers demonstrated an 11% higher repeat purchase rate over the following 20 weeks. Furthermore, line extensions experienced a 919% day-of-event sales lift and sustained a 107% sales increase after 20 weeks. These metrics illustrate why brand teams must look past same-day transaction volume to assess full program Return on Investment.
To understand how a dynamic activation calendar functions in practice, examine how a premium organic beverage brand resolved flat retail velocity across 450 national grocery locations. The brand faced stagnant distribution numbers, low consumer trial, and declining promotional efficiency. Competitors dominated main beverage aisle endcaps, and traditional temporary price discounts generated volume spikes followed by steep post-promotion dips.
Our team developed a synchronized retail activation calendar built on behavioral shopping missions rather than generic holidays. We identified two primary consumer consumption triggers: the morning rush hour routine and the 2:00 PM office productivity slump. Instead of executing weekend-only demonstrations, we deployed brand ambassadors on Tuesday and Thursday afternoons between 1:00 PM and 4:00 PM. This schedule engaged office workers and busy parents seeking clean, functional energy solutions.
We integrated physical field staffing with digital retail media and in-store merchandising. Every demonstration operated within 15 feet of secondary perimeter grab-and-go coolers stocked with chilled single-serve bottles. We launched localized mobile proximity ads around target store perimeters 30 minutes before field teams started pouring samples. We also ensured aligning retail logistics with field marketing was prioritized, preventing stock-outs by coordinating weekly shipments directly with regional distribution centers.
The commercial results validated the multi-layer calendar framework:
By synchronizing operational logistics, behavioral shopper missions, and localized field timing, the brand turned fragmented retail marketing spend into a repeatable, high-converting revenue driver.
Transforming your retail activation planning requires decisive operational action. Use this weekly implementation checklist to upgrade your marketing calendar over the next 30 days.

30 Years Experiential & Retail Activation Partner for CPG & Beverage Brands | Multi-Market Demos, Roadshows & Costco/Club Programs That Actually Sell