Robbie Thain
Founder, CEO

Learn how to build a rigorous profit and loss model for retail demo programs. Stop counting samples and start tracking conversion rates and real sales lift.

Retail marketing teams often judge sampling activations by the sheer volume of product handed out rather than the actual revenue generated. This guide breaks down how to build a rigorous profit and loss model that measures true financial impact across every store and event.
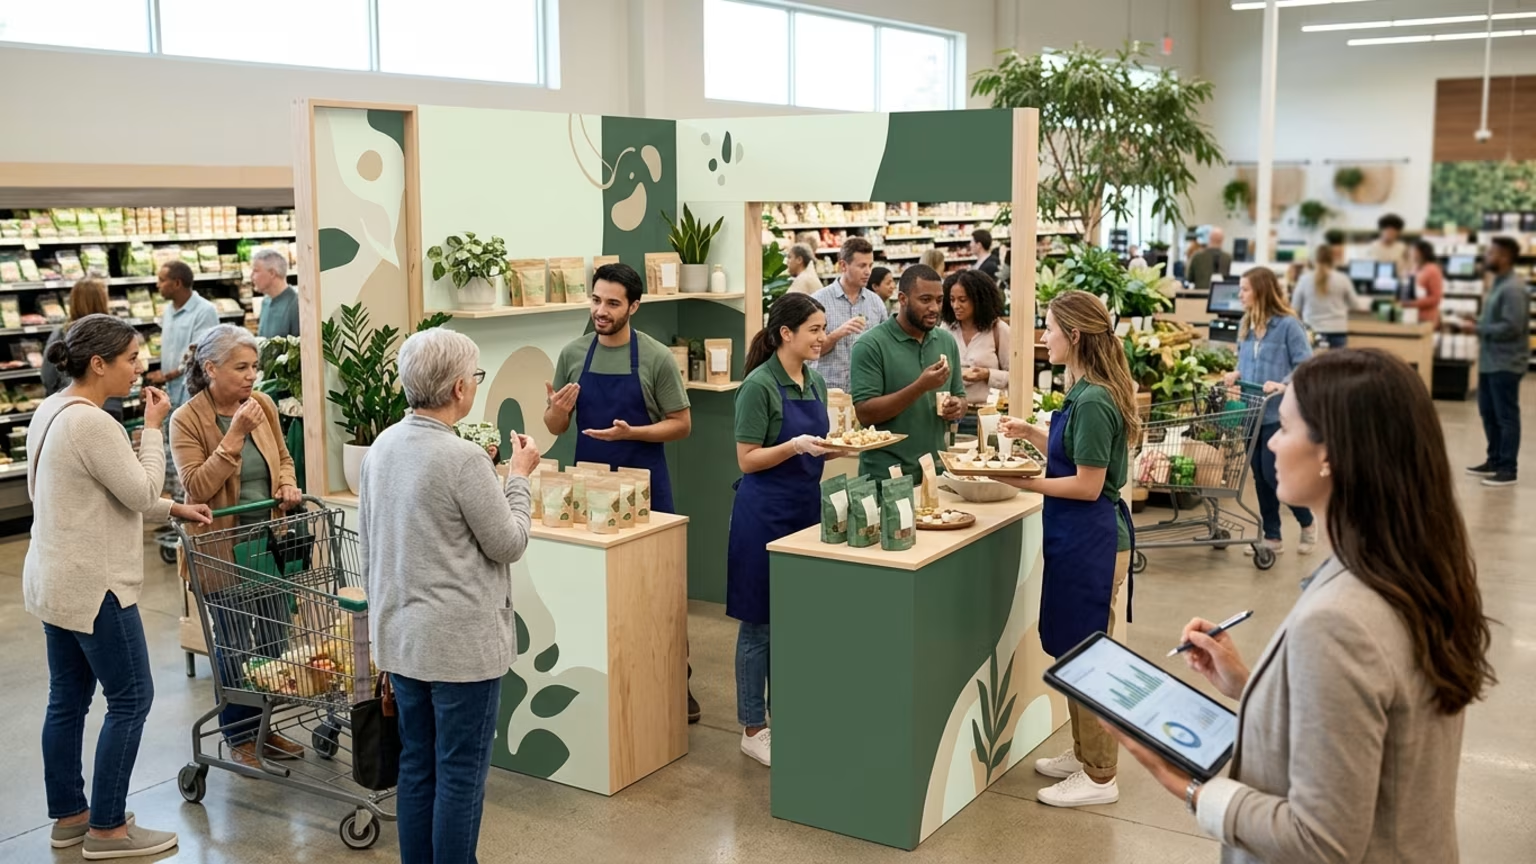
Field marketing teams face immense pressure to justify their budgets to executive leadership. They ship premium sampling kits across the country to support retail distribution. They hire temporary brand ambassadors to staff wholesale club environments. The resulting foot traffic feels incredibly validating in the moment to the team on the ground.
Yet the finance department remains unimpressed when sample counts fail to translate into sustained register rings. Field reps log the number of cups handed out during a four-hour shift. They count the total interactions at the promotional booth. These metrics do not provide a clear picture of financial viability.
This disconnect happens when marketers treat physical activations as simple brand awareness exercises. They prioritize the sheer volume of interactions over measured financial impact. The operational tension is clear across the consumer packaged goods industry. Brands spend heavily on travel logistics and premium payroll.
They ship pallets of product to regional distribution centers week after week. When Monday rolls around, they lack the data to prove that the weekend activity actually moved the needle. The focus must shift toward a strict financial model that proves true return on investment.
To fix this measurement gap, marketing leaders need strict financial modeling. The most effective framework mirrors standard ecommerce accounting principles. According to the DTC P&L Builder template, standard ecommerce profit and loss models distinguish variable costs from fixed operating expenses. Variable costs include things like shipping, processing, and ads. Fixed operating expenses cover salaries, software, and rent.
That exact structure maps perfectly to modeling demo program economics. Variable costs in a live activation include staff wages, per-store retailer fees, and the actual product consumed. Fixed costs represent your program management overhead, creative builds, and training software. Separating these expenses allows teams to see the true margin of every single store day. You can instantly identify which retail banners drive profitable volume.
Taking a granular approach directly impacts the bottom line across all service functions. A summary citing U.S. Small Business Administration data reports that service businesses using job-level cost tracking achieve roughly 15 to 25 percent higher net profit margins than those relying on month-end reconciliation.
You must treat every retail shift like an individual job to see these gains. This means assigning direct labor, materials, and travel costs to an exact retail location. A field marketing manager can then compare the gross sales lift against the precise cost of goods sold for that exact shift.
Building a profitable field marketing program requires operator-grade discipline. You need a systematic plan to turn live brand experiences into a measurable pipeline. Follow these steps to implement a rigorous financial framework across your next national roadshow or regional tasting schedule.
Moving past vanity metrics requires a firm grasp of both leading and lagging indicators. Leading metrics tell you if the activation is functioning correctly in real time on the floor. Lagging indicators confirm the actual financial output weeks after the event ends. You need both to evaluate retail demonstrations that drive real sales.
The retail industry provides a strong blueprint for this measurement strategy. A 2026 retail KPI benchmarks guide identifies conversion rate and revenue per guest as primary metrics for assessing in-store performance. This logic maps directly to your physical sampling efforts at the shelf.
You must track the conversion rate from a physical tasting to a direct purchase on the same day. The operation must measure the incremental revenue lift per visitor relative to non-demo days. Marketers rely on attribution for experiential campaigns to accurately connect live events to retail sell-through over a long period.
You can treat these physical activations as an extension of your advertising spend. Keen analyzed 182 brands to map retail media profit ROI by funnel, format, and retailer. This benchmark report offers a structured way to decide where the next retail media dollar should go. In-store interactions function as highly targeted, bottom-funnel media impressions that drive immediate register rings.
To maintain accountability, brands must establish clear financial baselines before launching a tour. A deep understanding of metrics that prove retail demo return on investment keeps the focus on incremental units sold. Stop reporting on the number of people who simply walked past the sampling booth. Measure the new households acquired and the qualified contacts captured.
Many brands hesitate to build a formal field marketing operation. The upfront fixed costs often appear steep to a conservative finance department. You have to account for management salaries, durable booth assets, and specialized routing software. Yet a single high-performing retailer activation frequently covers the entire baseline investment.
This dynamic is common in business-to-business environments and wholesale structures. ASI membership ROI analysis suggests that for many new distributors, the price difference between retail and trade on a single mid-size order typically covers the entire annual membership cost.
A similar math applies directly to physical sampling programs. One highly successful weekend blitz at a major wholesale club can generate enough margin to fund the operational overhead for the entire quarter. The key is isolating that single victory and understanding the exact variables that made it profitable.
At makai, we maximize this return by connecting the physical interaction to a digital capture system. We blend physical and digital experiences by integrating QR codes, mobile technology, and real-world activations into a cohesive retail layer. This connected strategy is not a standalone service but an upgrade we apply to many types of experiential work to drive trackable results.
The goal is to turn live brand experiences into a measurable pipeline that outlasts the weekend. You can stop guessing about the financial impact of your field marketing efforts. Establish your profit and loss structure, assign strict budgets per store, and track your revenue per guest. Book a strategy call with our team to start building a more profitable activation schedule today.

30 Years Experiential & Retail Activation Partner for CPG & Beverage Brands | Multi-Market Demos, Roadshows & Costco/Club Programs That Actually Sell