Robbie Thain
Founder, CEO

Learn how to build a CFO-ready Return on Investment model for mobile activations. Compare digital spend to real-world trial and track incremental retail lift.

The finance meeting starts at nine sharp with a spreadsheet projected on the wall. Your latest digital ad campaign shows millions of impressions but flat retail velocity. The CFO leans forward and asks for a hard financial reason to fund another physical pop-up. You need more than photos of smiling consumers to defend your field marketing budget.
Shifting budget from digital channels to real-world experiences requires a financial model built on hard sales metrics. This guide breaks down the exact cost structures and reporting frameworks needed to prove that mobile activations drive measurable retail velocity.
Event marketing often suffers from a reputation problem in the boardroom. Teams spend months designing beautiful custom trailers and booking high-traffic street permits. The activation runs flawlessly with massive crowds and empty sample boxes. Then the post-event report highlights loose metrics like brand sentiment and estimated foot traffic.
When finance asks for the exact cost per incremental unit sold, the room goes quiet. Marketing leaders struggle to defend their field budgets against digital teams who can track every click. This lack of financial rigor turns experiential marketing into an easy target during budget cuts. Field marketing directors know their live interactions drive brand loyalty.
Proving that loyalty translates to immediate cash flow requires a completely different analytical approach. You cannot pay for retail slotting fees with good vibes. The pressure rests entirely on proving that real-world engagements generate immediate consumer action. Digital tracking pixels are facing extreme pressure from modern privacy laws.
Physical activations offer a highly effective alternative for acquiring first-party data. A consumer willingly handing over their email for a free product is worth ten passive ad impressions. The challenge lies in translating that physical interaction into a standardized financial metric.
Digital campaigns appear highly efficient on paper but carry massive hidden inefficiencies. Ad fraud, bot traffic, and banner blindness severely inflate the true cost of acquiring a real human customer. Marketers often pay for impressions that a real person never sees. The tracking metrics look flawless but fail to translate into physical store movement.
Mobile activations carry obvious upfront costs but deliver pure human attention. A consumer holding a cold beverage in a grocery store parking lot has an absolute viewability rate. The physical sampling interaction eliminates the possibility of bot traffic. You are paying for verified human engagement in a real-world environment.
The financial model must account for the lifetime value of an in-person product trial. A consumer who tastes a product and speaks to a brand ambassador exhibits higher long-term loyalty. Digital channels often capture transactional buyers looking for discount codes. Physical activations build a relationship that leads to repeated retail purchases over months.
Factoring this repeated purchasing behavior into your Return on Investment model completely shifts the math. Your initial cost per trial might seem high compared to a cheap digital click. The long-term retention rate of that physical trial easily outpaces the digital cohort. Finance leaders understand lifetime value and will support strategies that maximize it.
To win budget battles against digital planners, experiential marketers must map their operational costs directly to commercial outcomes. Digital teams use cost per click and cost per acquisition to justify their existence. Field marketing must adopt cost per trial and cost per verified conversion to survive. A strong Return on Investment model isolates the hard costs of the mobile activation against the exact retail lift in that geographic radius.
This requires separating fixed setup costs from variable execution costs. Trailer fabrication and initial permitting represent fixed investments amortized across the entire tour. Brand ambassador hourly rates and daily sample inventory represent variable costs. By calculating the total variable cost per day and dividing it by the exact number of product trials, you find your base cost per engagement.
Finance teams respect this level of operational transparency. Building high-accountability mobile activations demands this exact cost isolation. Marketers must treat their event footprint like a real-world conversion funnel. Every person who walks past the footprint is a top-of-funnel prospect.
The strategy relies on moving those prospects into a tracked trial phase and pushing them toward a local retail purchase. A thousand samples distributed with zero tracking mechanisms is just a costly giveaway. A thousand samples distributed with a scanned QR code and a direct retail rebate becomes a measurable acquisition channel.
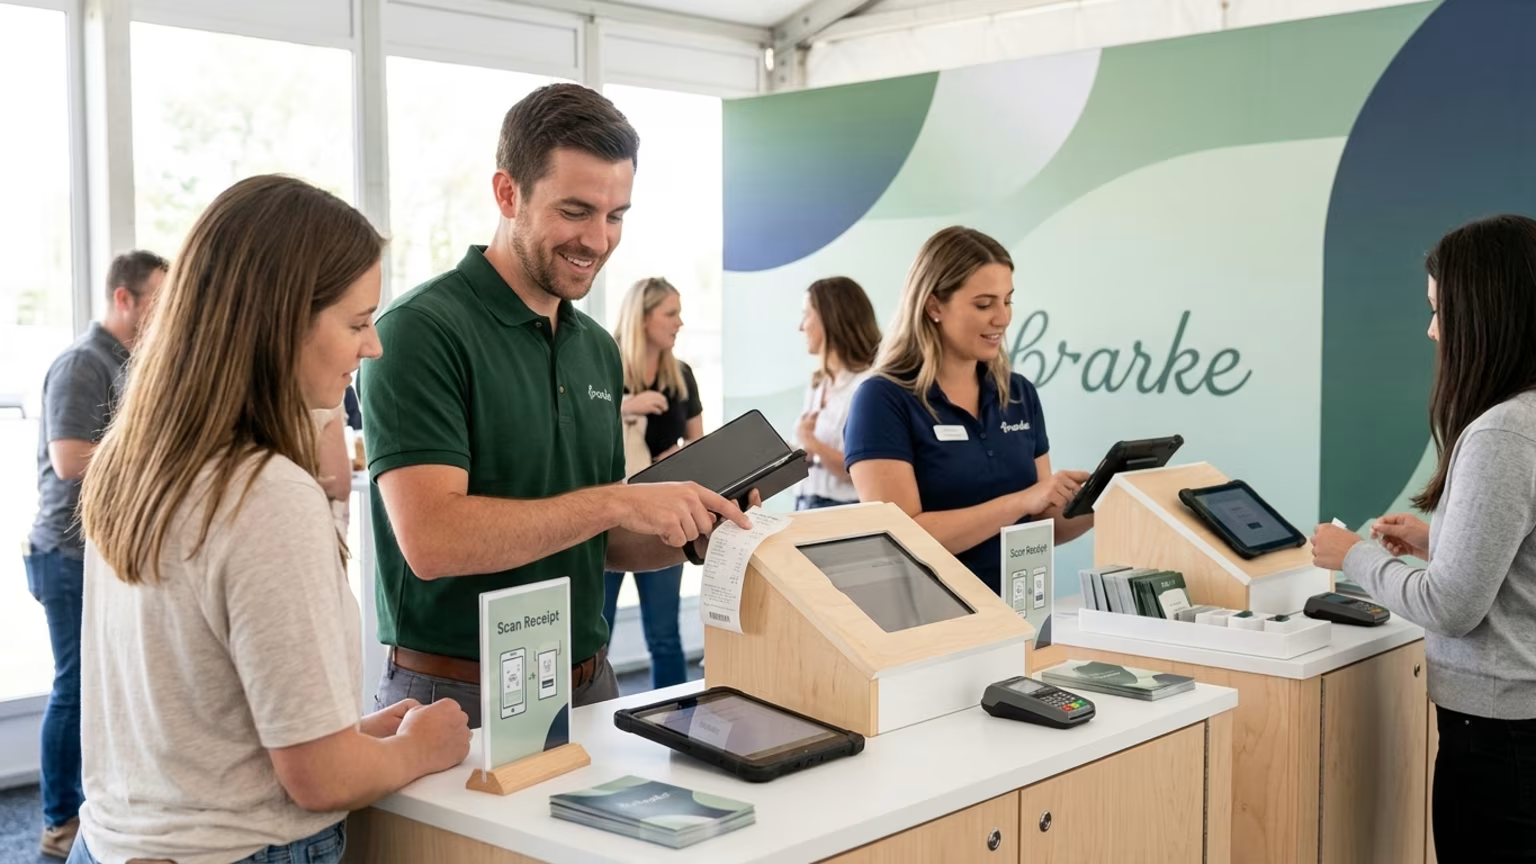
Tracking real-world sales requires tight operational discipline before the truck ever leaves the lot. You need a closed-loop system that connects the physical interaction to a digital receipt. We blend physical and digital experiences by integrating QR codes, mobile technology, and real-world activations into a cohesive layer across retail, event, and tour experiences. This connected strategy is not a standalone service but an upgrade we apply to many types of experiential work to drive trackable results.
To build this model correctly, you must implement a strict data collection sequence. Follow these exact steps to set up your campaign tracking.
This structured approach replaces guesswork with hard data. Every field event must have a localized digital landing page. This page serves as the bridge between the physical handshake and the final retail purchase. If you need help building this operational framework for your next launch, you can book a strategy call with our team.
Leading metrics show the immediate efficiency of your field operations. The primary leading indicator is your verified cost per trial. You calculate this by taking your daily operating expense and dividing it by the number of unique samples distributed to qualified consumers. You must track this number daily to identify inefficient tour stops.
Another key leading metric is the data capture rate. This measures the percentage of visitors who scan a QR code or submit an email address for a digital coupon. High data capture rates prove that your field staff is actively selling the value proposition.
Low capture rates indicate a problem with your messaging or your staffing quality. Measuring multi-city mobile sampling tours relies heavily on these daily leading indicators to adjust tactics on the fly.
Lagging metrics determine the actual Return on Investment for the business. Retail velocity lift stands out as the most important lagging indicator for consumer packaged goods. You measure the percentage increase in units sold at grocery locations within a five-mile radius of the activation. This local lift proves that your real-world interactions are moving actual inventory.
You must track the cost per incremental unit sold. This subtracts baseline sales from your post-event sales and divides your total activation cost by that difference. A successful activation will show a lower cost per incremental unit sold than your standard digital acquisition channels. This is the exact metric that secures long-term experiential funding.
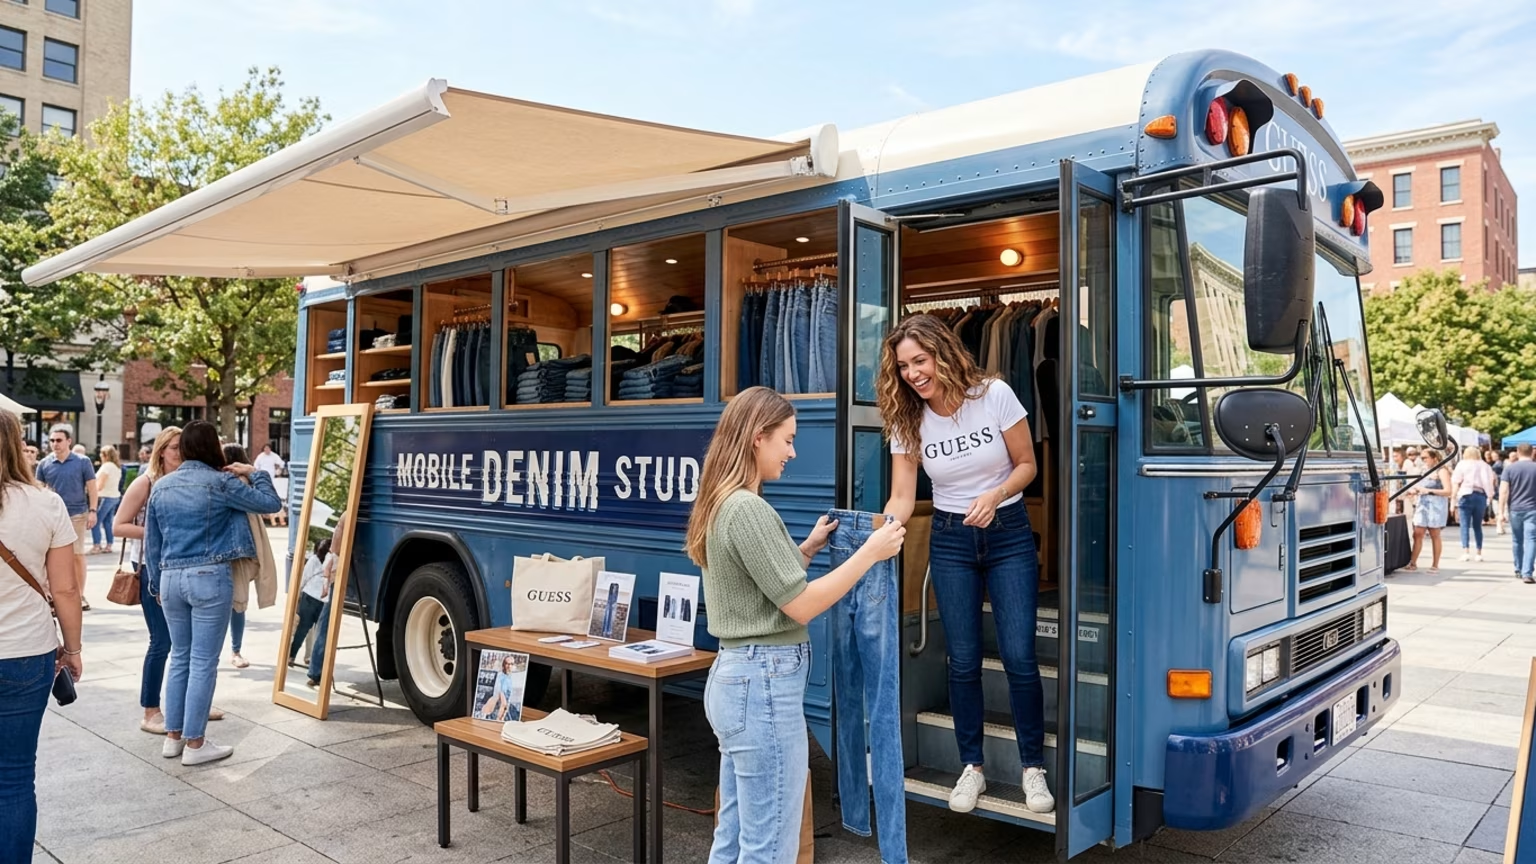
A national snack brand recently launched a new product line using a multi-city sampling tour. They faced intense pressure to justify the tour costs against their traditional paid social media spend. Our team deployed a custom sampling vehicle outside major grocery chains in their top three target markets. We focused entirely on driving immediate retail pull-through.
Brand ambassadors gave out full-size samples with a digital rebate link attached to the package. The team tracked exactly how many samples left the truck each hour. The rebate system captured the exact store location where the consumer purchased the full-size item. We monitored the local grocery data against a control city that only ran digital ads.
Within three weeks, the local retail data showed a distinct sales spike exactly correlated to the activation dates. The control city showed flat sales growth over the exact same period. The final model proved that the cost per incremental unit sold was lower than their standard digital acquisition cost. The CFO immediately approved a tour extension.
This is exactly how proving sampling sells with a clear Return on Investment model changes the entire budget conversation. It moves experiential marketing out of the brand awareness category and into the performance marketing bucket. Marketers no longer have to beg for budget when they bring verified conversion data to the table.
Live brand experiences are powerful business tools when measured with operational precision. Stop bringing soft metrics to hard financial meetings. Demand accountability from your events and watch your retail velocity climb.

30 Years Experiential & Retail Activation Partner for CPG & Beverage Brands | Multi-Market Demos, Roadshows & Costco/Club Programs That Actually Sell