Robbie Thain
Founder, CEO

Learn how to measure real ROI from mobile brand activations. Move beyond vanity foot traffic with a practical framework for connecting roadshows to actual sales.
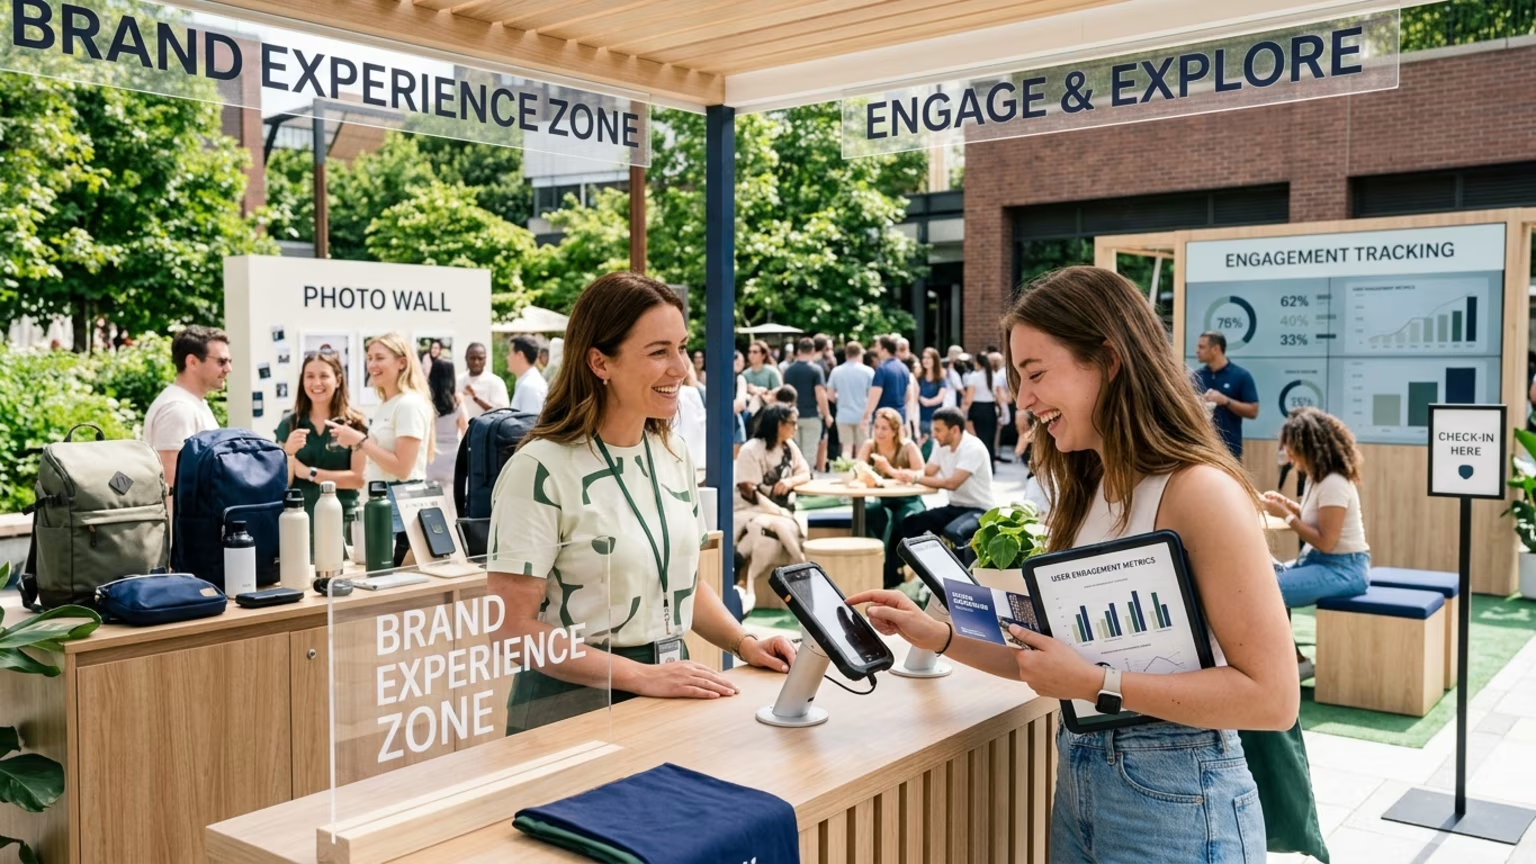
Global experiential marketing spending reached an estimated $138.94 billion in 2025. That staggering figure proves brands are buying live exposure, but exposure does not automatically equal commercial impact. Crowded event spaces and busy sampling vehicles simply establish that people had the opportunity to encounter a message. The Advertising Club notes that a stronger measurement system connects exposure and experience to memory, behavior, and incremental business outcomes.
Too many field programs still treat raw attendance as proof of success. A counter clicking ten thousand passersby is an opportunity metric rather than a business result. Foot traffic is the vanity metric that event producers often use to hide a lack of commercial evidence. Operators must define success in strict business terms before selecting a single venue or staffing model.
MarketingCharts, citing PQ Media, reported that global experiential spending reached an estimated $138.94 billion in 2025. The same report forecast a 10.3% growth rate for 2026. The summary identified the U.S. as the largest experiential market globally. The U.S. accounted for 46.4% of global spending and saw 9.3% growth in 2025.
These numbers show a massive financial commitment to live brand experiences. Leaders must now prove that this capital actually drives retail sell through and customer acquisition. The days of justifying budgets with high attendee counts have ended. Executive teams require hard retail metrics instead of subjective enthusiasm.
A VP of Marketing managing a fragmented trade marketing budget cannot deposit impressions into the bank. They need to know if their field measurement framework for events will result in actual pipeline. The IAB recommends establishing the business question, primary KPI, and control design before the study begins. Teams should also define the meaningful lift threshold and intended action early.
This alignment prevents a team from selecting event locations merely because they promise large crowds. The ultimate goal for a CPG roadshow is understanding true incrementality. NIQ defines incrementality as the sales that would not have happened without the specific spend. NIQ argues that incrementality analysis needs purchase data plus the surrounding commerce conditions.
These conditions include price, promotion, availability, and distribution. A redeemed coupon might simply subsidize a purchase that a consumer planned to make anyway. Marketers must evaluate baseline sales against new activity to see true lift. NIQ advises that brands should not use return on ad spend as a substitute for true incrementality.
This macro demand for accountability forces a structural change in how brands execute mobile tours. Practitioner frameworks commonly organize activation measurement into reach, engagement, affinity, and pipeline layers. This structure helps teams separate useful evidence from impressive but meaningless foot traffic. Our team at makai treats technology as the infrastructure that makes a predefined measurement plan executable.
We blend physical and digital experiences by integrating QR codes, mobile technology, and real world activations into a cohesive layer. This integration applies across retail, event, and tour experiences to drive connected results. It is not just an add on service but a fundamental upgrade for experiential work. This upgrade allows us to track consumers from initial exposure to final purchase.
Foot traffic is an opportunity to engage metric rather than a return metric. A counter can show how many people passed a sampling cart. It cannot establish that they noticed the brand or tried the product. A verified trial followed by a tracked purchase is substantially more useful evidence.
Dwell time provides directional evidence of depth rather than proof of persuasion. Longer time onsite does not automatically mean stronger brand preference or higher sales. Teams must move past dwell time and focus on qualified interactions. AnyRoad presents engagement rate as interactions divided by foot traffic.
Brands should define an interaction consistently before using that measure. A qualified interaction should have a defined minimum action like a product conversation or a completed demo. Leads must be qualified and tracked downstream to prove actual business value. Total scans or contact records do not equal commercial leads.
Coupons and codes create a direct bridge to purchase. Teams should use unique codes by market, venue, or day. They must also distinguish coupons issued from coupons redeemed. Redemption should be reported alongside incremental units, discount cost, and profit margin.
Brands should calculate standard return using a simple formula. Return on Investment equals attributed revenue minus total activation cost, divided by total activation cost. Attributed revenue is not always incremental revenue. Teams must use test and control groups to find true expected revenue absent the activation.
AnyRoad describes brand lift measurement as comparing exposed audiences with matched controls. They provide client or illustrative examples of purchase intent differences. These vendor reported examples illustrate what is possible. However, they often use proprietary methods and should not be treated as universal benchmarks.
Repeat purchase tests whether the activation created durable behavior. A consumer who buys once during a promotion may have responded to price or convenience. Repeat purchase should be tracked within a pre specified period and compared with a relevant baseline. Crawford Group recommends distinguishing pipeline sourced from pipeline influenced.
They also suggest tracking realized Return on Investment over longer sales cycle windows. Teams should report leading and lagging indicators on different timelines. Foot traffic and opt ins are immediate indicators. Retailer sell through and lead acceptance might take up to thirty days to materialize.
Operational data quality can easily undermine the most sophisticated analysis. Missing consent, duplicate scans, and inconsistent staff definitions make a polished dashboard misleading. Untagged links, unavailable inventory, and incomplete retail data also ruin measurement accuracy. Measurement specifications should become part of the operating brief.
This brief must detail data ownership, timestamp standards, deduplication rules, and reporting deadlines. When field execution data connects directly with ecommerce analytics and retailer systems, marketing leaders gain total visibility. Metrics to prove field activation return require this level of operational discipline. A strict brief prevents activity metrics from masquerading as financial outcomes.
A practical measurement system separates data into three distinct reporting layers. The operational report covers staffing, locations, inventory, and foot traffic. The marketing report tracks trial rate, opt in rate, coupon redemption, and brand recall. The business report focuses on incremental units, retail sell through, and closed revenue.
This structure lets the operations team improve execution without inflating financial results. It also ensures that executives only see metrics tied to actual commercial outcomes. To measure mobile activations across the buyer journey, teams must maintain this separation strictly. Confusing an operational metric with a business result is a critical failure.
A roadshow rarely happens in a perfectly controlled environment. Markets differ in weather, retail availability, local events, and media investment. Any matched market design should document how these differences were handled by the analytics team. Results should include specific limitations rather than implying laboratory level certainty.
A well planned scorecard separates operational compliance from actual business results. Marketing leaders must adjust their dashboards this quarter to reflect behavior rather than mere presence. Before launch, teams should specify exactly what happens after each result arrives. Operators should scale the program if incremental sales exceed the threshold at an acceptable margin.
They must optimize the experience if engagement is strong but trial or conversion is weak. Teams should change locations if the qualified interaction rate remains low despite high traffic. If the activation produces neither meaningful engagement nor incremental commercial value, operators must stop the program. Evaluating how brands plan mobile roadshow tours requires patience and precise data hygiene.
The most valuable activations do not just stop people in their tracks. They quietly shift consumer behavior long after the activation packs up and leaves town. The true measure of an experiential campaign is what a consumer does when the brand is no longer standing in front of them. Operators who master this measurement will secure their budgets and build lasting market share.

30 Years Experiential & Retail Activation Partner for CPG & Beverage Brands | Multi-Market Demos, Roadshows & Costco/Club Programs That Actually Sell