Robbie Thain
Founder, CEO
Stop guessing about event ROI. Learn how a unified reporting dashboard connects live experiential activations to retail sell-through and proves business impact.
Experiential marketing generates massive amounts of on-site data that often gets lost in disconnected spreadsheets. Integrating lead capture and retail metrics into a single reporting dashboard gives marketing leaders the exact proof they need to justify their budgets.
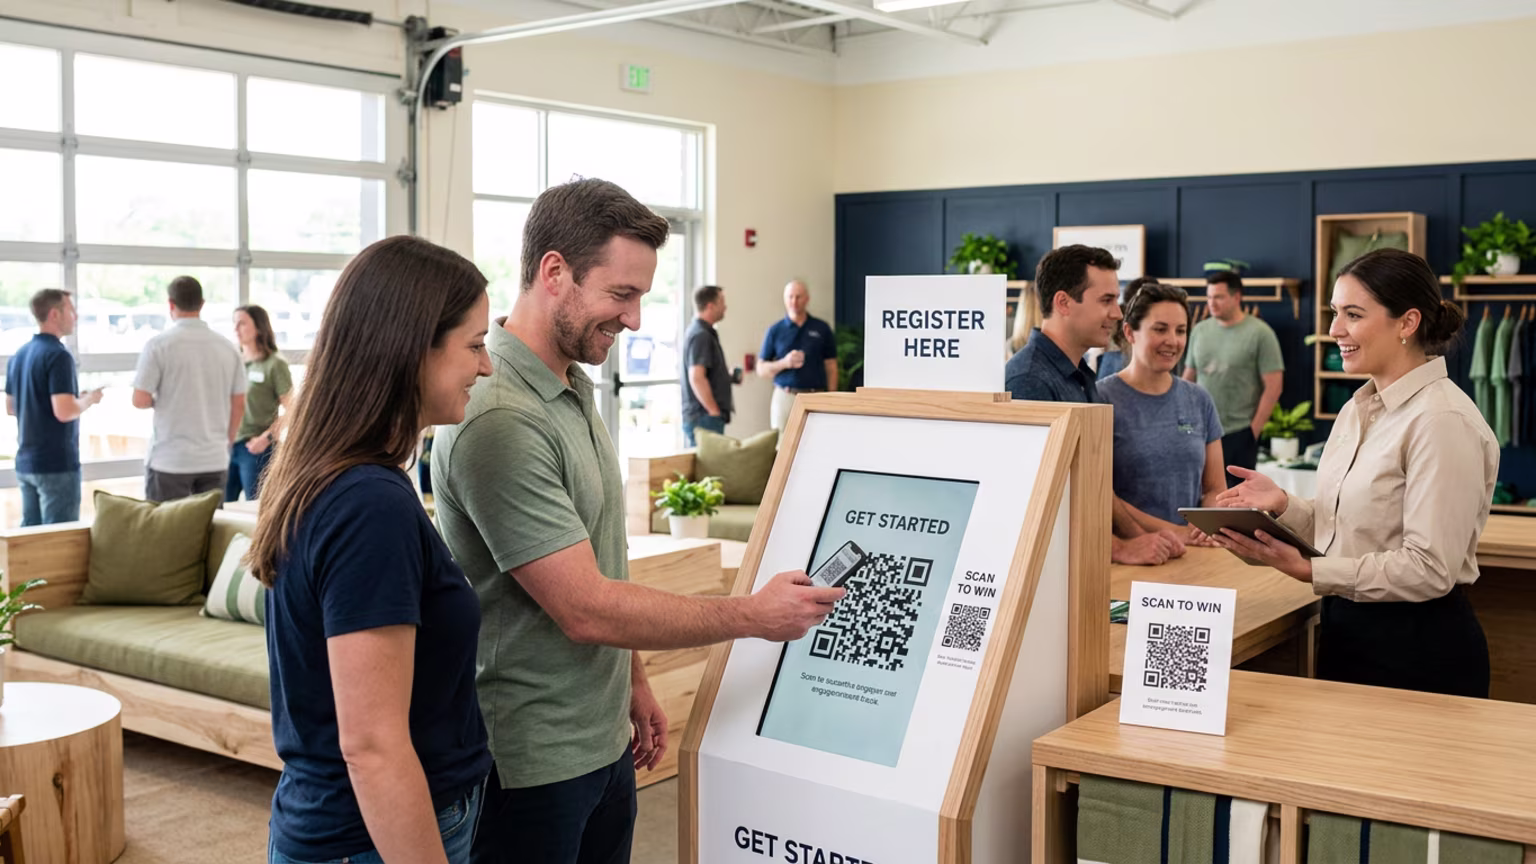
Sarah stands at the edge of the convention floor holding a tablet filled with unreadable badge scans. Her team just finished a three-day national sampling activation. She now faces the daunting task of manually typing hundreds of leads into a spreadsheet. The regional sales director is already asking for retail sell-through numbers.
This scenario plays out across countless food and beverage activations every weekend. Field teams collect thousands of interactions using disconnected apps. The sales team waits days for proper lead routing. Retail partners wonder if the local popup actually drove traffic to their specific aisles.
This manual coordination tax creates severe delays and compliance risks for operations managers. Relying on scattered reports makes measuring actual success nearly impossible. A brand executing fifteen different activations cannot manually prove which events generate actual revenue. They end up guessing which locations produce actual trial and conversion.
Industry analysts report that bad data alone costs businesses an average of 15 million dollars per year. Fragmented systems compound this risk exponentially for field teams. Relying on manual data transfer drains time from your most capable staff members. Marketing operators need a better way to measure Return on Investment without the administrative headache.
Over 90 percent of enterprises report that single-hour system downtime costs exceed 300,000 dollars. For experiential teams relying on digital integrations, siloed systems compound this financial risk. It is time to connect the dots between live interactions and downstream revenue. Organizations must use experiential marketing reporting and clean data to stop treating event metrics as an afterthought.
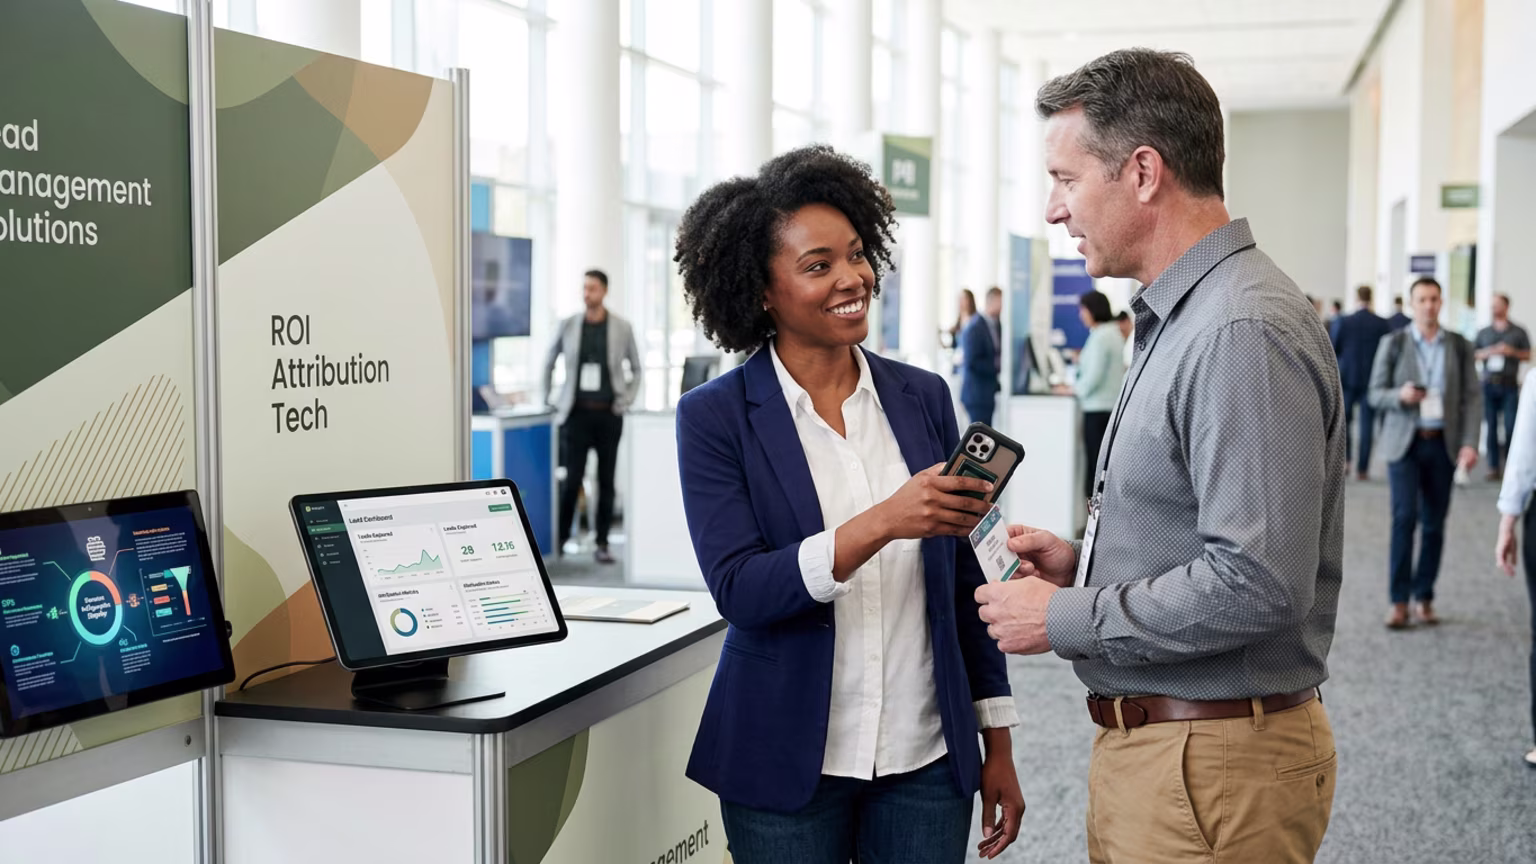
The fix requires moving away from static spreadsheets and building a predictive operations dashboard. This architecture connects lead capture tools directly with retail point-of-sale systems. When everyone accesses the same data source, sales and marketing leaders align around shared business outcomes. This operational transparency builds immediate trust with your retail partners.
You must first map every digital tool involved in your field operations. This ecosystem includes your badge scanners, retail partner integration feeds, and customer relationship management software. You cannot build a clear picture if you leave key data sources out of the initial framework. A complete map prevents analytical blind spots down the road.
Building and maintaining a unified dashboard requires a dedicated cross-functional team. You need data engineers for system integration and data pipeline reliability. You need operations managers for defining key performance indicators and interpreting the actual insights. IT leadership must be involved early to guarantee security, compliance, and platform scalability.
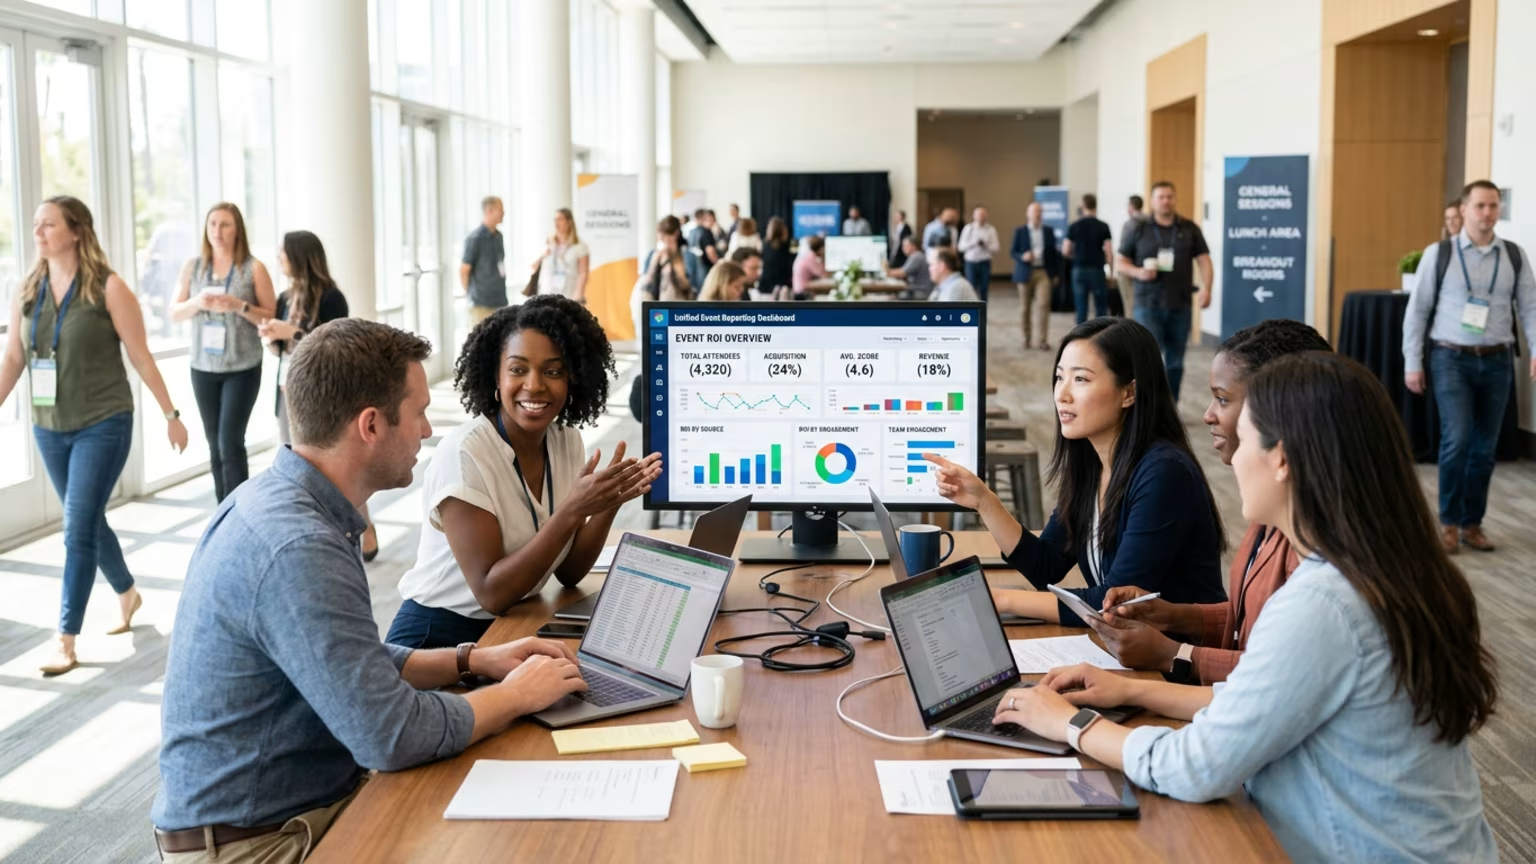
Your sales team can view lead quality in real time when systems communicate properly. Field teams understand their performance expectations and can adjust their tactics mid-event. Advanced dashboards flag performance risks by severity before they become major problems. The dashboard becomes the operational backbone that connects field efforts to actual sales.
One of our clients, a Brand Manager in the alcohol beverage space, shared their experience: 'Working with Makai completely transformed our operation. The activation blew past all our KPIs and created a lasting emotional connection with our customers. Simply outstanding work.' This client saw their activation exceed all key performance indicators and build deep emotional connections with their audience.
We see the direct impact of this operational discipline every single day. Teams that treat their event lead capture processes as a science always win. They capture attention in the real world and turn it into highly measurable pipeline.
Building this centralized system requires disciplined execution and a clear technical plan. You need to gather data from every touchpoint where consumers interact with your brand. The goal is to make complex metrics easily digestible for busy directors. Here is the exact process for building your centralized reporting structure.
This systematic approach protects your brand from major operational failures. Implementing these steps helps CPG brands connect live events to retail sales with incredible precision. You take the guesswork out of your most expensive field campaigns.
A unified system only works if you track the correct indicators. You must define exact lead and lag metrics for clear reporting. Vanity numbers like total booth visitors do not help you make smart business decisions. You need numbers that prove your physical activations generate real financial momentum.
Lead metrics tell your team how the activation is performing right now. You should track real-time sample distribution rates and average consumer dwell times. You must monitor staff utilization to see if your brand ambassadors are having meaningful conversations. Catching a dip in these numbers allows you to adjust your approach immediately.
Lag metrics prove the long-term financial return of your activation. You need to measure retail sell-through rates in the days following your local event. Calculate the final cost per qualified lead and track the trial-to-purchase conversion percentage. These figures prove to the executive team that your field strategy delivers strong ROI.
Event data platforms allow brands to compare metrics across different events and track improvement over time. You can benchmark your local performance against national industry averages. You can calculate the financial return of the dashboard itself. Track the money saved from fewer technology outages and faster problem resolution times.
Automated tracking systems reduce incident response times by up to 50 percent according to industry research. This level of speed saves money and protects your brand reputation on the floor. You spend less time fixing broken tablets and more time engaging with potential buyers. The technology pays for itself through faster order fulfillment and fewer manual troubleshooting hours.
We see the power of connected data every time we run a national retail roadshow. A recent deployment required managing multiple simultaneous activations across different regional markets. The client needed to know exactly which locations were driving the most product trials. They could not afford to wait until Monday for a written report.
They needed actionable intelligence on Saturday afternoon. We connected their on-site tablet data directly to their central sales platform. The regional managers could watch the trial numbers update live on their mobile phones. If a specific store showed low engagement, the field director called the local team to adjust the sampling display.
This real-time visibility completely changed their management approach. The brand avoided wasting thousands of dollars on ineffective staffing setups. They reallocated their best brand ambassadors to the highest-performing store aisles. Good data empowers good managers to make brilliant tactical decisions.
Recent corporate learning studies show that managers using connected data tools see massive performance gains within 90 days. The same principle applies directly to field marketing and retail demonstrations. Your dashboard is the tool that transforms field marketing from an art into a hard science. It proves that physical consumer engagement drives measurable outcomes when properly executed.
You can stop guessing about your field marketing performance today. Book a strategy call to map out a clear measurement plan for your next major activation.

30 Years Experiential & Retail Activation Partner for CPG & Beverage Brands | Multi-Market Demos, Roadshows & Costco/Club Programs That Actually Sell

Since 1995, Makai has been connecting brands with people through live experiences, retail programs, and national activations.