Robbie Thain
Founder, CEO
Learn how to optimize street activation staffing with data-driven ratios. Use exact formulas to reduce labor costs, increase trial conversion, and prove ROI.
Inconsistent staffing turns high-traffic street events into chaotic bottlenecks that bleed money. This guide provides exact data-driven staffing ratios to maximize trial conversion and prove measurable Return on Investment.
The line stretches past the sampling station. Your brand ambassador is frantically handing out product. A frustrated prospect checks their watch and walks away. That single departure represents the silent death of your activation.
Experiential agencies know that mismanaged labor creates sheer chaos. You face a hard truth when traffic surges at a local street activation. Your team either operates perfectly or crumbles under the intense pressure. Overburdened teams abandon their brand scripts to move lines faster.
Idle promoters stand around wasting payroll when foot traffic suddenly dips. Queuing psychology completely dictates consumer behavior in these live environments. Industry research consistently shows that perceived waits beyond three minutes sharply reduce satisfaction. Every additional minute of unoccupied waiting decreases purchase intent by up to 20 percent.
Prospects will simply leave if they wait five minutes for a snack sample. You lose the interaction and the potential lifetime value of that shopper. Overstaffing presents an equally damaging scenario for your marketing budget. Six ambassadors working a slow street event will completely intimidate normal passersby.
Your labor cost per trial doubles without generating any extra business output. You need a better way to map your labor directly to real foot traffic. Many U.S.-based brands spend thousands on event permits and custom booth fabrication. They then ruin the execution by blindly guessing their required field staff headcount.
Untrained or haphazardly hired staff compound this problem even further. A single untrained representative cannot hold consumer attention in a loud physical environment. Proper execution demands people who clearly understand pacing, line management, and emotional connection. Chaos erupts when field managers lack the authority to adjust headcounts mid-event.
You must treat staffing as a variable equation that scales perfectly with demand. This requires building repeatable frameworks for field marketing excellence based on hard data. You can project exact labor needs by deeply understanding baseline throughput capacity. A single trained brand ambassador handles 80 to 120 samples per hour in a structured format.
Street sampling capacity varies heavily based on the required depth of engagement. A light engagement sample allows one ambassador to serve 150 people per hour. A moderate engagement with a quick pitch drops that capacity to 80 interactions per hour. High-engagement micro-demos restrict your maximum capacity to 50 targeted interactions per hour.
Automotive test drives require an entirely different mathematical formula. The typical experiential test drive takes 20 minutes from check-in to final post-drive questions. One product specialist managing one car can complete exactly three test drives per hour. You will quickly build a massive backlog if foot traffic exceeds your vehicle capacity.
Two cars running optimally will support a maximum of six test drives per hour. The strategic approach bridges the exact gap between available capacity and expected demand. You assign designated roles to exact stages of the live consumer funnel. Automotive activations need separate ambassadors for check-ins, product walkthroughs, and lead collection.
Dividing these exact tasks prevents bottlenecks and keeps the main product specialist completely focused. You calculate expected interactions by multiplying total expected footfall by your historical capture rate. A crowd of one thousand people with a 15 percent capture rate yields 150 interactions. This structured methodology protects your brand reputation and your budget simultaneously.
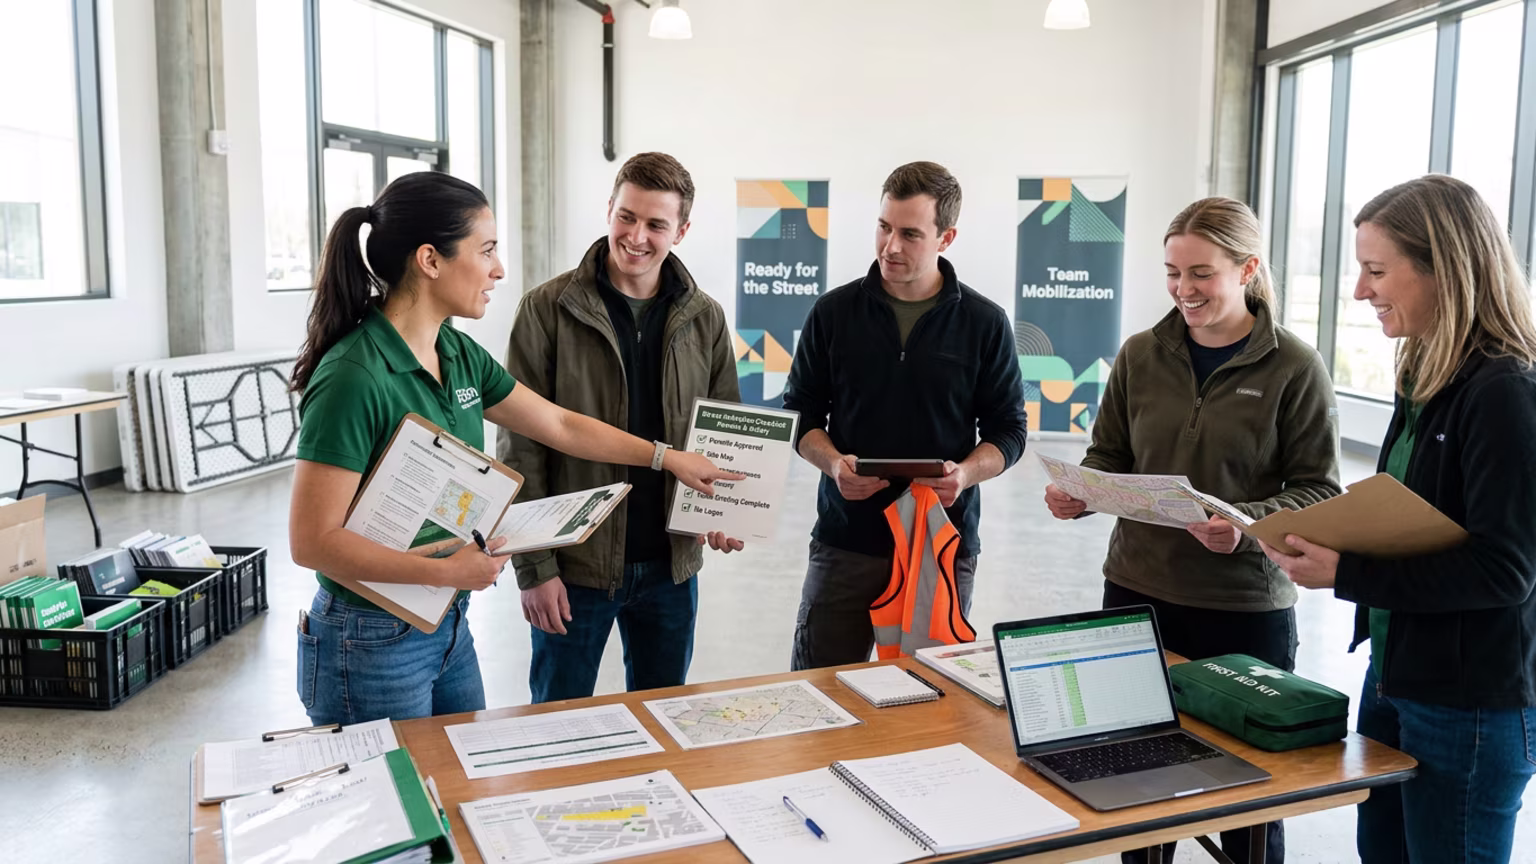
Moving from guesswork to precision requires a highly structured operational plan. Field managers must follow a step-by-step model to achieve optimal event throughput. This execution playbook standardizes the approach across every single roadshow stop.
Dialing in these exact details sets the firm foundation for optimizing field staffing models for scalable experiential activations. You cannot effectively scale a national tour without standardizing these daily field calculations. A defined playbook completely removes friction for your local managers in different cities. They can simply plug live data into the formula and run the exact play.
Proving the true value of live brand experiences requires rigorous performance tracking. Measuring ROI in experiential activations from foot traffic to sales lift demands extreme discipline. You must track both the leading indicators of efficiency and the lagging indicators of revenue. CFOs will gladly approve future marketing budgets when you provide this level of exact math.
The first primary leading metric is the ambassador utilization rate. This measures the actual time spent actively engaging prospects against wasted idle time. A low utilization rate clearly indicates gross overstaffing or poor traffic capture. The second leading metric is the raw interaction volume achieved per hour.
Cost per trial serves as your absolute primary lagging metric. You calculate this figure by dividing total labor costs by the number of completed interactions. High-performing street campaigns keep this designated cost low without ever sacrificing engagement quality. You must strictly track the conversion rate from trial to purchase or lead capture.
Another fundamental lag metric is the incremental sales margin generated by the local activation. You calculate the gross margin impact by multiplying total purchases by the average unit value. Subtract your total labor costs from this margin to find your true net return. These exact numbers form the indisputable basis of your true return metric.
Consider a sample scenario where your daily labor budget equals four hundred dollars. An optimized team serving one thousand samples drops your labor cost per trial dramatically. An overstaffed team serving the exact same number of samples entirely wastes your event budget. You double your unit cost without producing any additional pipeline value.
Understaffing creates an entirely different threat to your gross margin. A team capped at five hundred interactions leaves hundreds of potential buyers waiting in line. Those unserved prospects represent pure lost revenue for your brand. You literally cap your own growth potential by failing to staff appropriately for high traffic.
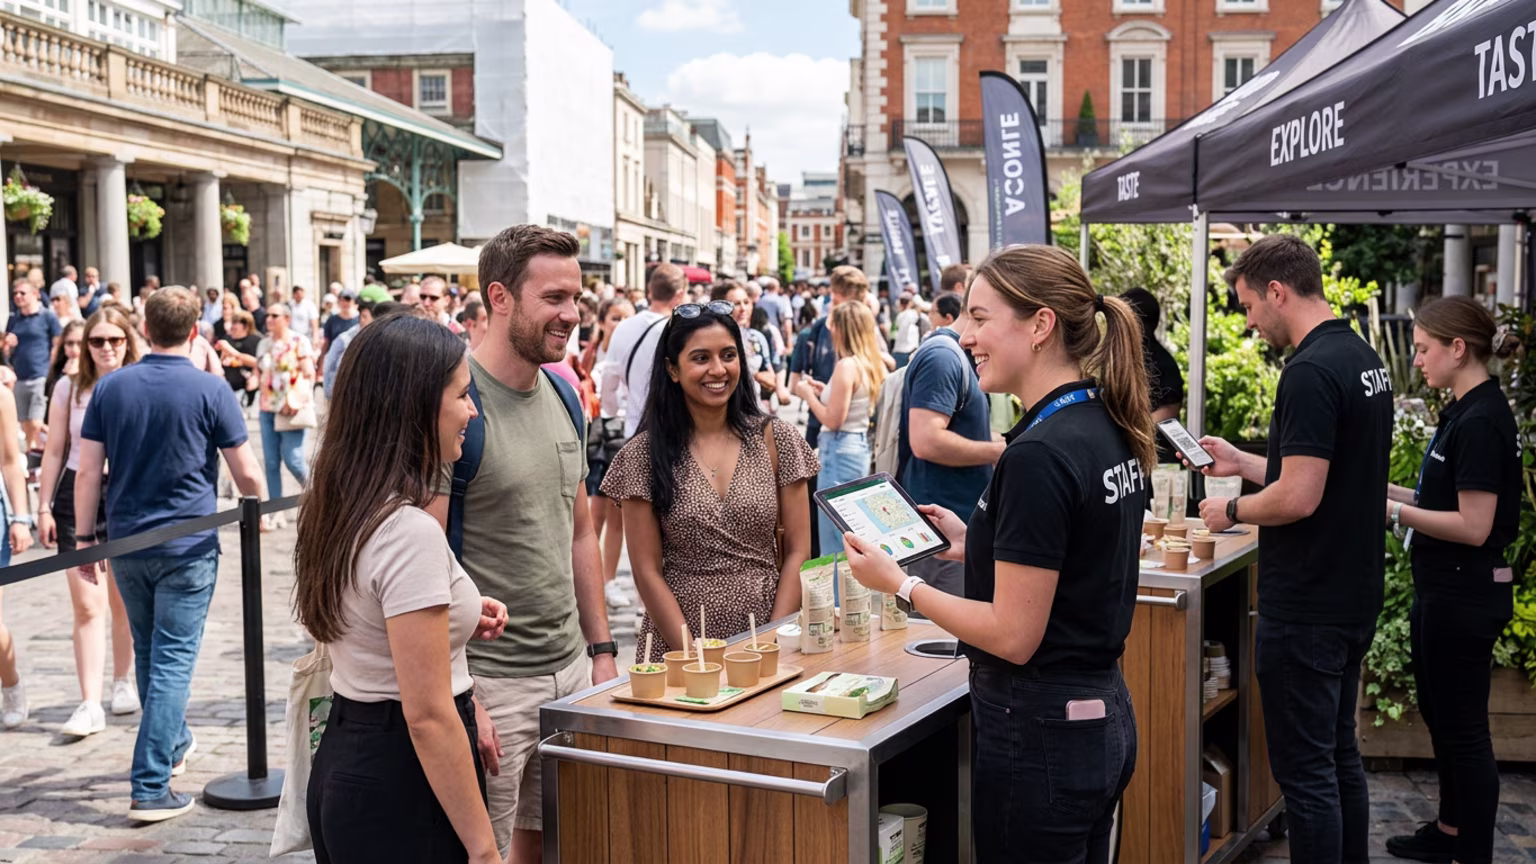
Digital tools and smart lead apps make this tracking process incredibly seamless. You can deeply analyze hour-by-hour throughput using mobile device analytics and digital waiver forms. This data allows you to rapidly refine your staffing ratios for the next event day. Real-time metrics replace vague post-event summaries with highly actionable operational intelligence.
A premium beverage brand recently applied this data-driven formula to a national street tour. They previously staffed four ambassadors per tent regardless of the expected local footfall. This arbitrary approach consistently generated high labor costs and wildly inconsistent consumer interactions. They quickly implemented a dynamic model based on the 80-sample per hour benchmark.
The field team deliberately reduced staffing to two active ambassadors during morning shifts. They scaled up to five active ambassadors during the high-traffic afternoon rush. Active sampling with these properly trained ambassadors rapidly improved trial rates by 40 percent. The brand drastically reduced their total labor cost per trial by adjusting the roster dynamically.
Their field manager diligently tracked the utilization rate during every single shift. They noticed a sudden dip in afternoon throughput during a rainy street activation day. The manager instantly shifted two ambassadors to a covered walkway to capture passing pedestrian traffic. This rapid adjustment kept the hourly sample counts perfectly aligned with their established benchmarks.
You can meticulously engineer your live events to produce predictable pipeline value. Precision logistics transform fleeting interactions into highly measurable consumer response. Stop letting unpredictable crowds completely dictate the financial success of your expensive roadshow investments. Book a strategy call with our experiential experts to build your custom staffing calculator today.

30 Years Experiential & Retail Activation Partner for CPG & Beverage Brands | Multi-Market Demos, Roadshows & Costco/Club Programs That Actually Sell

Since 1995, Makai has been connecting brands with people through live experiences, retail programs, and national activations.