Robbie Thain
Founder, CEO
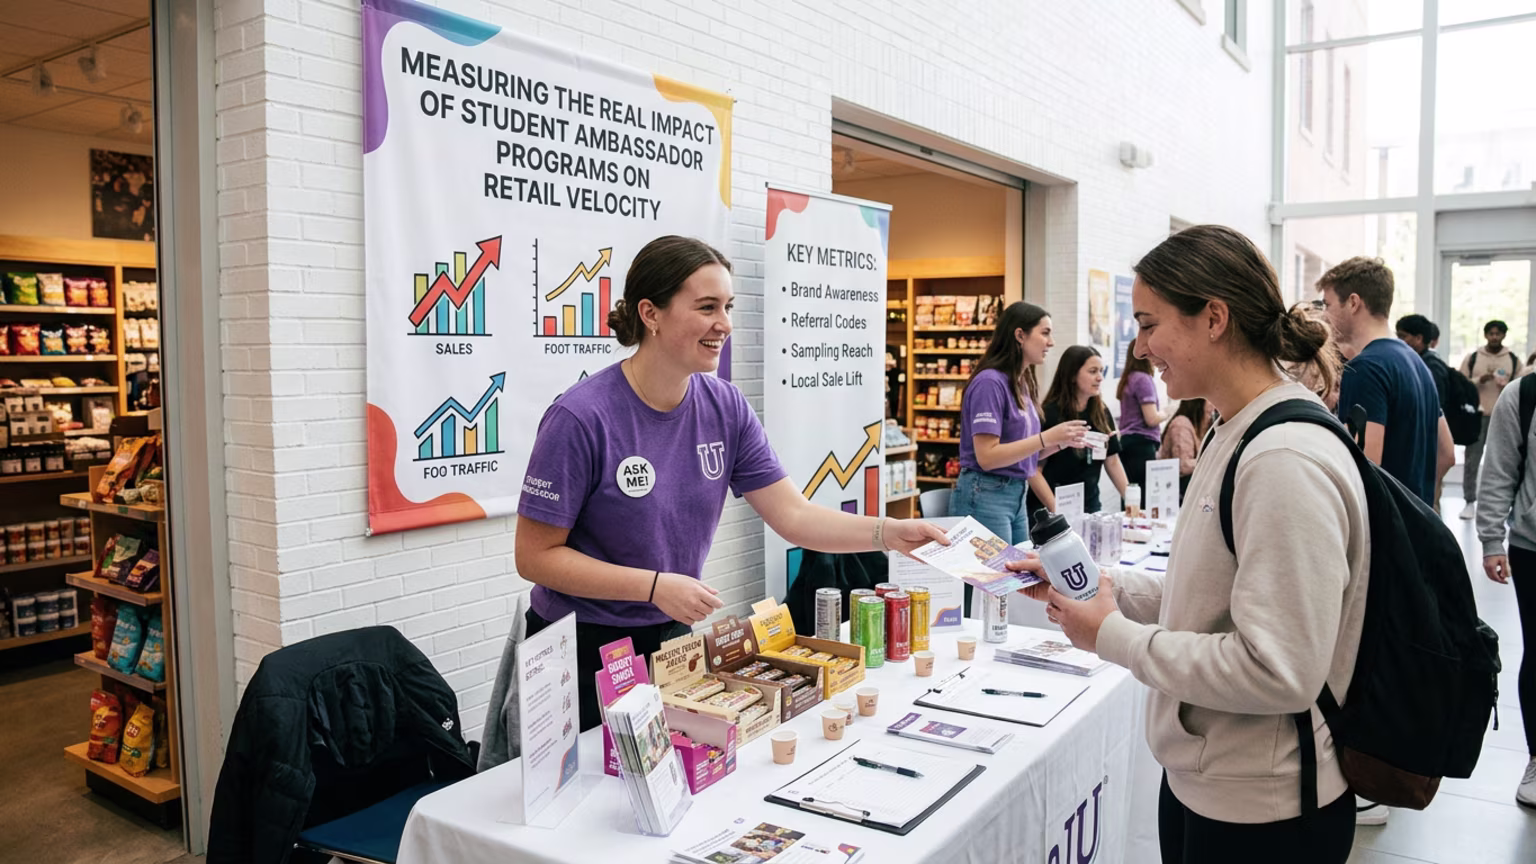
A practical system to show ROI from demos, roadshows, and activations using clean, simple inputs, even when POS data is delayed or messy. Built for brand leaders who need proof, not excuses.
.avif)
Quick answer: You can prove experiential ROI without perfect data by using a simple measurement system with three layers: execution proof (did it happen), performance signals (what changed), and business outcomes (what it likely drove). When you collect the same few data points every time, you can compare markets, learn fast, and defend budget decisions with confidence.
Experiential programs are very real. You can see people taste, ask questions, buy, and tell friends. Yet when leadership asks, “Did it work,” many teams struggle to answer in a clean way.
That is not because experiential is unmeasurable. It is because data is often scattered. POS might arrive late. Store level reporting might not match event dates. A roadshow might run in one part of the store while the product sells in another. A mobile tour might drive interest that shows up weeks later.
The goal of ROI reporting is not to create a perfect academic study. It is to give decision makers a fair and repeatable view of impact, then improve performance over time. This post gives you a system you can run across retail demonstrations, Costco roadshows, mobile sampling tours, and event activations.
To make ROI easier, separate what you can prove from what you can estimate.
This answers one question: did the program run the way we said it would. If you cannot prove execution, arguing ROI is pointless.
Signals are immediate indicators that something moved. They are not the final business result, but they tell you if the activation was working in the moment.
Outcomes are what leaders care about. These include sales, trial, distribution wins, and long term brand lift. Outcomes can be measured directly or estimated when data is limited.
If you want a system that is efficient, keep the data set small. Most teams fail by tracking too much and doing none of it consistently.
Here is a minimum set that works across most programs.
This data set is fast to collect and powerful when you repeat it. It also supports the planning habits covered in Experiential marketing brief template. How to set up agencies for success and Field marketing manager checklist. Store visits, demos, and local events.
Sometimes you have perfect store level data, sometimes you do not. You still need a way to speak about impact in a credible way. Here are three practical methods.
Pick a small set of similar stores that did not run the program in the same weeks. Compare their sales trend to the activated stores. You are not chasing perfect scientific proof. You are trying to show a reasonable pattern.
Compare the activation week to an average of a few weeks before it. This works well for roadshows and repeated demos.
If sales data arrives late, use signals that correlate with sales and are visible immediately.
When POS arrives later, you can validate the proxy. Over time, this builds trust in your model.
Many teams lose credibility by over claiming. A better approach is to show the full picture with honest labels. Leaders usually respond well when you separate facts from estimates.
This style of reporting is clean and hard to argue with. It is also useful for buyer conversations, since retailers respect programs that are measured without hype.
You do not need a complicated spreadsheet to speak in ROI terms. You can create a range with a few inputs.
Then report ROI as a range, not a single magical number. For example:
Even a simple range is enough to guide decisions. The key is consistency.
If your leader will only read one page, make that page count. A strong one page summary has:
This keeps the conversation focused on learning and scaling, not defending basic facts.
ROI reporting is not only for internal leaders. It can also help win better placement and expansion.
This is one reason why well documented experiential work can move brands faster than paid media alone. It creates proof that is hard to fake.
A simple and honest measurement system beats a complex report every time.
If you want experiential work to earn budget year after year, your reporting must be repeatable. Start with the minimum data set. Run it for the next month across your demos, roadshows, or tour stops. Then tighten the model based on what leaders ask and what your team can realistically capture.
If you want help designing programs that are built for clean measurement, you can review engagement marketing, retail demonstrations, and Costco roadshows, then request a proposal or contact us. When you measure the same way every time, ROI becomes a calm conversation, not a debate.

30 Years Experiential & Retail Activation Partner for CPG & Beverage Brands | Multi-Market Demos, Roadshows & Costco/Club Programs That Actually Sell

Since 1995, Makai has been connecting brands with people through live experiences, retail programs, and national activations.